- Page 2:
František Baluška · Stefano Manc
- Page 5 and 6:
Dr. František Baluška University
- Page 7 and 8:
VI Preface turn, reward the ants by
- Page 9 and 10:
VIII Preface of olfactory response.
- Page 12 and 13:
Contents 1 The Green Plant as an In
- Page 14 and 15:
Contents XIII 6 Signals and Targets
- Page 16 and 17:
Contents XV 11 Amino Acid Transport
- Page 18 and 19:
Contents XVII 15 Regulation of Plan
- Page 20 and 21:
Contents XIX 21.3 Conclusions and P
- Page 22:
Contents XXI 27.3.2 Catechin Induce
- Page 25 and 26:
XXIV Contributors Correa-Aragunde,
- Page 27 and 28:
XXVI Contributors Lamattina, L. (e-
- Page 29 and 30:
XXVIII Contributors Song, C. Depart
- Page 31 and 32:
1 The Green Plant as an Intelligent
- Page 33 and 34:
1 The Green Plant as an Intelligent
- Page 35 and 36:
1 The Green Plant as an Intelligent
- Page 37 and 38:
1 The Green Plant as an Intelligent
- Page 39 and 40:
1 The Green Plant as an Intelligent
- Page 41 and 42:
1 The Green Plant as an Intelligent
- Page 43 and 44:
1 The Green Plant as an Intelligent
- Page 45 and 46:
1 The Green Plant as an Intelligent
- Page 47 and 48:
1 The Green Plant as an Intelligent
- Page 49 and 50:
2 Neurobiological View of Plants an
- Page 51 and 52:
2 Neurobiological View of Plants an
- Page 53 and 54:
2 Neurobiological View of Plants an
- Page 55 and 56:
2 Neurobiological View of Plants an
- Page 57 and 58:
2 Neurobiological View of Plants an
- Page 59 and 60:
2 Neurobiological View of Plants an
- Page 61 and 62:
2 Neurobiological View of Plants an
- Page 63 and 64:
2 Neurobiological View of Plants an
- Page 65:
2 Neurobiological View of Plants an
- Page 68 and 69:
38 P.W. Barlow Thestimulipresentedt
- Page 70 and 71:
40 P.W. Barlow that a tropism is su
- Page 72 and 73:
42 P.W. Barlow the auxin flow into
- Page 74 and 75:
44 P.W. Barlow afferentnervousimpul
- Page 76 and 77:
46 P.W. Barlow analysis. In particu
- Page 78 and 79:
48 P.W. Barlow reception of his boo
- Page 80 and 81:
50 P.W. Barlow Iijima M, Kono Y (19
- Page 83 and 84:
4 How Can Plants Choose the Most Pr
- Page 85 and 86:
4 How Can Plants Choose the Most Pr
- Page 87 and 88:
4 How Can Plants Choose the Most Pr
- Page 89 and 90:
4 How Can Plants Choose the Most Pr
- Page 91 and 92:
4 How Can Plants Choose the Most Pr
- Page 93:
4 How Can Plants Choose the Most Pr
- Page 96 and 97:
66 P.M. Neumann Finally, I examined
- Page 98 and 99:
68 P.M. Neumann evolutionary progre
- Page 100 and 101:
70 P.M. Neumann conclusion is that
- Page 102 and 103:
72 P.M. Neumann resources from matu
- Page 105 and 106:
6 Signals and Targets Triggered by
- Page 107 and 108:
6TargetsofSI 77 6.1.2 Self-Incompat
- Page 109 and 110:
6TargetsofSI 79 by Yang 2002) has p
- Page 111 and 112:
6TargetsofSI 81 al. 2002). Thus, SI
- Page 113 and 114:
6TargetsofSI 83 Fig.6.2. PrABP80 ha
- Page 115 and 116:
6TargetsofSI 85 many of the genes e
- Page 117 and 118:
6TargetsofSI 87 [Ca 2+ ]i may signa
- Page 119 and 120:
6TargetsofSI 89 is crosstalk betwee
- Page 121 and 122:
6TargetsofSI 91 Hepler PK, Vidali L
- Page 123:
6TargetsofSI 93 Snowman BN, Kovar D
- Page 126 and 127:
96 T. Nürnberger, B. Kemmerling Wh
- Page 128 and 129:
98 T. Nürnberger, B. Kemmerling Fo
- Page 130 and 131:
100 T. Nürnberger, B. Kemmerling p
- Page 132 and 133:
102 T. Nürnberger, B. Kemmerling i
- Page 134 and 135:
104 T. Nürnberger, B. Kemmerling r
- Page 136 and 137:
106 T. Nürnberger, B. Kemmerling F
- Page 138 and 139:
108 T. Nürnberger, B. Kemmerling M
- Page 141 and 142:
8 Nitric Oxide Involvement in Incom
- Page 143 and 144:
8 Nitric Oxide Involvement in Incom
- Page 145 and 146:
8 Nitric Oxide Involvement in Incom
- Page 147 and 148:
8 Nitric Oxide Involvement in Incom
- Page 149 and 150:
8 Nitric Oxide Involvement in Incom
- Page 151:
8 Nitric Oxide Involvement in Incom
- Page 154 and 155:
124 M.L. Lanteri et al. 9.1.1 Auxin
- Page 156 and 157:
126 M.L. Lanteri et al. Fig.9.1. Sc
- Page 158 and 159:
128 M.L. Lanteri et al. Fig.9.2. NO
- Page 160 and 161:
130 M.L. Lanteri et al. 9.3.1 Nitri
- Page 162 and 163:
132 M.L. Lanteri et al. Fig.9.3. Sc
- Page 164 and 165:
134 M.L. Lanteri et al. Bellamine J
- Page 166 and 167:
136 M.L. Lanteri et al. Pagnussat G
- Page 168 and 169:
138 S.J. Murch H 3C CH3 CH3 N H 2C
- Page 170 and 171:
140 S.J. Murch edible plants (Manch
- Page 172 and 173:
142 S.J. Murch However, over the la
- Page 174 and 175:
144 S.J. Murch of monoamine, amino
- Page 176 and 177:
146 S.J. Murch On Guam and in other
- Page 178 and 179:
148 S.J. Murch 10.4 Conclusions and
- Page 180 and 181:
150 S.J. Murch Lindstrom H, Luthman
- Page 183 and 184:
11 Amino Acid Transport in Plants a
- Page 185 and 186:
11 AA transport in plant versus neu
- Page 187 and 188:
11 AA transport in plant versus neu
- Page 189 and 190:
11 AA transport in plant versus neu
- Page 191 and 192:
11 AA transport in plant versus neu
- Page 193 and 194:
11 AA transport in plant versus neu
- Page 195 and 196:
11 AA transport in plant versus neu
- Page 197 and 198:
11 AA transport in plant versus neu
- Page 199 and 200:
11 AA transport in plant versus neu
- Page 201 and 202:
12 GABA and GHB Neurotransmitters i
- Page 203 and 204:
12 GABA and GHB Neurotransmitters i
- Page 205 and 206:
12 GABA and GHB Neurotransmitters i
- Page 207 and 208:
12 GABA and GHB Neurotransmitters i
- Page 209 and 210:
12 GABA and GHB Neurotransmitters i
- Page 211 and 212:
12 GABA and GHB Neurotransmitters i
- Page 213 and 214:
12 GABA and GHB Neurotransmitters i
- Page 215:
12 GABA and GHB Neurotransmitters i
- Page 218 and 219:
188 M. Gilliham et al. Fig.13.1. Ar
- Page 220 and 221:
190 M. Gilliham et al. as compatibl
- Page 222 and 223:
192 M. Gilliham et al. apex (Zhang
- Page 224 and 225:
194 M. Gilliham et al. 13.3.3 Are A
- Page 226 and 227:
196 M. Gilliham et al. sufficiently
- Page 228 and 229:
198 M. Gilliham et al. 2005). It is
- Page 230 and 231:
200 M. Gilliham et al. 13.4.5 NSCC
- Page 232 and 233:
202 M. Gilliham et al. Kang J, Meht
- Page 234 and 235:
204 M. Gilliham et al. Zheng Y, Mel
- Page 236 and 237:
206 E.B. Blancaflor, K.D. Chapman F
- Page 238 and 239:
208 E.B. Blancaflor, K.D. Chapman N
- Page 240 and 241:
210 E.B. Blancaflor, K.D. Chapman v
- Page 242 and 243:
212 E.B. Blancaflor, K.D. Chapman l
- Page 244 and 245:
214 E.B. Blancaflor, K.D. Chapman N
- Page 246 and 247:
216 E.B. Blancaflor, K.D. Chapman 1
- Page 248 and 249:
218 E.B. Blancaflor, K.D. Chapman G
- Page 251 and 252:
15 Regulation of Plant Growth and D
- Page 253 and 254:
15 Regulation of Plant Growth and D
- Page 255 and 256:
15 Regulation of Plant Growth and D
- Page 257 and 258:
15 Regulation of Plant Growth and D
- Page 259 and 260:
15 Regulation of Plant Growth and D
- Page 261 and 262:
15 Regulation of Plant Growth and D
- Page 263 and 264:
15 Regulation of Plant Growth and D
- Page 265 and 266:
16 Physiological Roles of Nonselect
- Page 267 and 268:
16 Nonselective cation channels 237
- Page 269 and 270:
16 Nonselective cation channels 239
- Page 271 and 272:
Fig.16.1. Possible roles of nonsele
- Page 273 and 274:
16 Nonselective cation channels 243
- Page 275 and 276:
16 Nonselective cation channels 245
- Page 277 and 278:
16 Nonselective cation channels 247
- Page 279 and 280:
17 Touch-Responsive Behaviors and G
- Page 281 and 282:
17 Touch-Responsive Behaviors and G
- Page 283 and 284:
17 Touch-Responsive Behaviors and G
- Page 285 and 286:
17 Touch-Responsive Behaviors and G
- Page 287 and 288:
17 Touch-Responsive Behaviors and G
- Page 289 and 290:
17 Touch-Responsive Behaviors and G
- Page 291 and 292:
18 Oscillations in Plants Sergey Sh
- Page 293 and 294:
18 Oscillations in Plants 263 Tempo
- Page 295 and 296:
18 Oscillations in Plants 265 Dries
- Page 297 and 298:
18 Oscillations in Plants 267 backg
- Page 299 and 300:
18 Oscillations in Plants 269 The f
- Page 301 and 302:
18 Oscillations in Plants 271 prehe
- Page 303 and 304:
18 Oscillations in Plants 273 Cardo
- Page 305:
18 Oscillations in Plants 275 Shaba
- Page 308 and 309:
278 K.Trebacz,H.Dziubinska,E.Krol W
- Page 310 and 311:
280 K.Trebacz,H.Dziubinska,E.Krol T
- Page 312 and 313:
282 K.Trebacz,H.Dziubinska,E.Krol E
- Page 314 and 315:
284 K.Trebacz,H.Dziubinska,E.Krol 1
- Page 316 and 317:
286 K.Trebacz,H.Dziubinska,E.Krol n
- Page 318 and 319:
288 K.Trebacz,H.Dziubinska,E.Krol D
- Page 320 and 321:
290 K.Trebacz,H.Dziubinska,E.Krol S
- Page 322 and 323:
292 R. Stahlberg, R.E. Cleland, E.
- Page 324 and 325:
294 R. Stahlberg, R.E. Cleland, E.
- Page 326 and 327:
296 R. Stahlberg, R.E. Cleland, E.
- Page 328 and 329:
298 R. Stahlberg, R.E. Cleland, E.
- Page 330 and 331:
300 R. Stahlberg, R.E. Cleland, E.
- Page 332 and 333:
302 R. Stahlberg, R.E. Cleland, E.
- Page 334 and 335:
304 R. Stahlberg, R.E. Cleland, E.
- Page 336 and 337:
306 R. Stahlberg, R.E. Cleland, E.
- Page 338 and 339:
308 R. Stahlberg, R.E. Cleland, E.
- Page 340 and 341:
310 E.Davies,B.Stankovic It is assu
- Page 342 and 343:
312 E.Davies,B.Stankovic 21.2 Evide
- Page 344 and 345:
314 E.Davies,B.Stankovic Fig.21.3.
- Page 346 and 347:
316 E.Davies,B.Stankovic Relative m
- Page 348 and 349:
318 E.Davies,B.Stankovic 1992; Beel
- Page 350 and 351:
320 E.Davies,B.Stankovic Hentze MW,
- Page 352 and 353:
322 J. Fromm, S. Lautner in the ran
- Page 354 and 355:
324 J. Fromm, S. Lautner cells (Sam
- Page 356 and 357:
326 J. Fromm, S. Lautner 22.5 Ion C
- Page 358 and 359:
328 J. Fromm, S. Lautner hastobedon
- Page 360 and 361:
330 J. Fromm, S. Lautner Beilby MJ,
- Page 362 and 363:
332 J. Fromm, S. Lautner Williams S
- Page 364 and 365: 334 S. Mancuso, S. Mugnai like the
- Page 366 and 367: 336 S. Mancuso, S. Mugnai 2,000 nM
- Page 368 and 369: 338 S. Mancuso, S. Mugnai the fourt
- Page 370 and 371: 340 S. Mancuso, S. Mugnai “slow-w
- Page 372 and 373: 342 S. Mancuso, S. Mugnai 23.6 Airb
- Page 374 and 375: 344 S. Mancuso, S. Mugnai that tree
- Page 376 and 377: 346 S. Mancuso, S. Mugnai Fort C, F
- Page 378 and 379: 348 S. Mancuso, S. Mugnai Pophof B,
- Page 381 and 382: 24 Electrophysiology and Phototropi
- Page 383 and 384: 24 Electrophysiology and Phototropi
- Page 385 and 386: 24 Electrophysiology and Phototropi
- Page 387 and 388: 24 Electrophysiology and Phototropi
- Page 389 and 390: 24 Electrophysiology and Phototropi
- Page 391 and 392: 24 Electrophysiology and Phototropi
- Page 393 and 394: 24 Electrophysiology and Phototropi
- Page 395 and 396: 24 Electrophysiology and Phototropi
- Page 397: 24 Electrophysiology and Phototropi
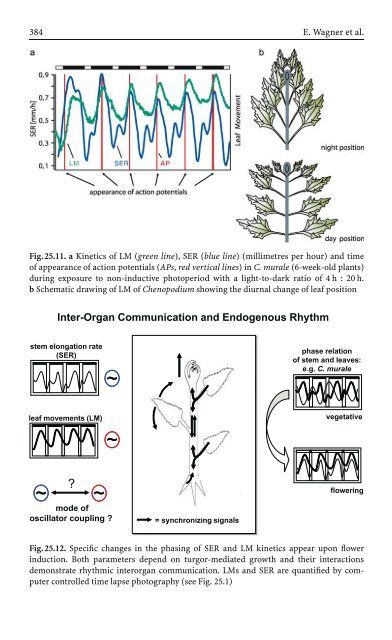
- Page 400 and 401: 370 E. Wagner et al. Table 25.1. Fl
- Page 402 and 403: 372 E. Wagner et al. Exudation [µl
- Page 404 and 405: 374 E. Wagner et al. metabolism at
- Page 406 and 407: 376 E. Wagner et al. The circadian
- Page 408 and 409: 378 E. Wagner et al. Fig.25.5. Time
- Page 410 and 411: 380 E. Wagner et al. Fig.25.7. Patt
- Page 412 and 413: 382 E. Wagner et al. Fig.25.9. Time
- Page 416 and 417: 386 E. Wagner et al. 25.9 Conclusio
- Page 418 and 419: 388 E. Wagner et al. Lecharny A, Wa
- Page 421 and 422: 26 Signals and Signalling Pathways
- Page 423 and 424: 26 Signals and Signalling Pathways
- Page 425 and 426: 26 Signals and Signalling Pathways
- Page 427 and 428: 26 Signals and Signalling Pathways
- Page 429 and 430: 26 Signals and Signalling Pathways
- Page 431: 26 Signals and Signalling Pathways
- Page 434 and 435: 404 L.G. Perry et al. properties (S
- Page 436 and 437: 406 L.G. Perry et al. Fig.27.1. A s
- Page 438 and 439: 408 L.G. Perry et al. phytotoxins i
- Page 440 and 441: 410 L.G. Perry et al. monooxygenase
- Page 442 and 443: 412 L.G. Perry et al. 27.4 (±)-Cat
- Page 444 and 445: 414 L.G. Perry et al. (±)-catechin
- Page 446 and 447: 416 L.G. Perry et al. mineralizatio
- Page 448 and 449: 418 L.G. Perry et al. Dyer AR (2004
- Page 450 and 451: 420 L.G. Perry et al. Singh HP, Bat
- Page 452 and 453: 422 V.Ninkovic,R.Glinwood,J.Petters
- Page 454 and 455: 424 V.Ninkovic,R.Glinwood,J.Petters
- Page 456 and 457: 426 V.Ninkovic,R.Glinwood,J.Petters
- Page 458 and 459: 428 V.Ninkovic,R.Glinwood,J.Petters
- Page 460 and 461: 430 V.Ninkovic,R.Glinwood,J.Petters
- Page 462 and 463: 432 V.Ninkovic,R.Glinwood,J.Petters
- Page 464 and 465:
434 V.Ninkovic,R.Glinwood,J.Petters
- Page 466 and 467:
436 Subject Index defense 67, 95-10
- Page 468:
438 Subject Index sieve-tube-elemen