- Page 1 and 2:
United States Department of Agricul
- Page 3 and 4:
PROCEEDINGS OF THE 2009 NORTHEASTER
- Page 5 and 6:
OUTDOOR RECREATION—TRAILS Experie
- Page 7 and 8:
GIS APPLICATIONS AND RECREATION RES
- Page 9 and 10:
diff erent points along the spectru
- Page 11 and 12:
Proceedings of the 2009 Northeaster
- Page 13 and 14:
amount of bare rock. Camel’s Hump
- Page 15 and 16:
Larson, M. 2004. A Passive Approach
- Page 17 and 18:
THE ROLE OF IMAGINATION IN EXPERIEN
- Page 19 and 20:
Table 1.—Special places surveys L
- Page 21 and 22:
For some people, being in their spe
- Page 23 and 24:
CLIMATE CHANGE AND RESOURCE PLANNIN
- Page 25 and 26:
large geographical area (Fig. 1). T
- Page 27 and 28:
Divers seen = 4.4 Figure 2.—Norm
- Page 29 and 30:
Table 4.—Most-specialized divers
- Page 31 and 32:
Sarah Young Human Dimensions of Mar
- Page 33 and 34:
3.0 RESULTS AND DISCUSSION Th e FRR
- Page 35 and 36:
Table 4.—Divers’ perception of
- Page 37 and 38:
YOUTH AND OUTDOOR RECREATION
- Page 39 and 40:
A qualitative research design was u
- Page 41 and 42:
containers, instead of plastic bags
- Page 43 and 44:
WALK, RIDE AND LEARN: STUDENTS’ D
- Page 45 and 46:
school. Because of the large sample
- Page 47 and 48:
Table 8.—Observation of built str
- Page 49 and 50:
“I’M TOO OLD TO GO OUTSIDE!”
- Page 51 and 52:
Mean Eco-Affinity Score 5.0 4.5 4.0
- Page 53 and 54:
children. In: Klenosky, David B., F
- Page 55 and 56:
Cherie LeBlanc Fisher U.S Forest Se
- Page 57 and 58:
Table 1.—Comparative statistics f
- Page 59 and 60:
did some fi shing himself at each s
- Page 61 and 62:
On the other hand, some personal kn
- Page 63 and 64:
Illinois Department of Natural Reso
- Page 65 and 66:
Consumer behavior researchers have
- Page 67 and 68:
50 percent of the households were d
- Page 69 and 70:
y respondents indicated that these
- Page 71 and 72:
a bivariate approach (instead of th
- Page 73 and 74:
HERITAGE TOURISM DEVELOPMENT IN RUR
- Page 75 and 76:
Short cruise season. Th e river fre
- Page 77 and 78:
Lynda J. Sperazza, Ph.D. Recreation
- Page 79 and 80:
2.3 Leisure Participation Values Re
- Page 81 and 82:
Dychtwald, K. 1999. Age power: How
- Page 83 and 84:
With all research, the research que
- Page 85 and 86:
comprehensive. Cross (2005) even ar
- Page 87 and 88:
Stillwater, OK: Oklahoma State Univ
- Page 89 and 90:
EXPERIENCE USE HISTORY AND ITS RELA
- Page 91 and 92:
Table 1.—Comparison of experience
- Page 93 and 94:
5.0 DISCUSSION As mentioned previou
- Page 95 and 96:
HUMAN DIMENSIONS OF WILDLIFE
- Page 97 and 98:
2.0 METHODS Data were collected at
- Page 99 and 100:
0 buses 4 buses 8 buses 12 buses Fi
- Page 101 and 102:
4.0 DISCUSSION Visitor surveys and
- Page 103 and 104:
LEISURE AND HEALTH
- Page 105 and 106:
Second, in a world where clean drin
- Page 107 and 108:
Table 1.—Importance of different
- Page 109 and 110:
Countries also need to be careful a
- Page 111 and 112:
Proceedings of the 2009 Northeaster
- Page 113 and 114:
Table 1.—Informant profi les Info
- Page 115 and 116:
do something and we might think it
- Page 117 and 118:
Th ese relational interactions enab
- Page 119 and 120:
EXPLORING ELEMENTS THAT INFLUENCE S
- Page 121 and 122:
trails, and asking others to stay o
- Page 123 and 124: time/fi nances” in dune protectio
- Page 125 and 126: In summary, this study explored the
- Page 127 and 128: Jinhee Jun Texas A&M University jju
- Page 129 and 130: Table 1.—Sample demographics Indi
- Page 131 and 132: Grayson 1995). Th e fi t of this mo
- Page 133 and 134: Stets, J.E.; Burke, P.J. 2003. A so
- Page 135 and 136: Jiaying Lu Texas A& M University Ji
- Page 137 and 138: Table 1.—Demographic and particip
- Page 139 and 140: Table 3.—Factor analysis of motiv
- Page 141 and 142: species sought, satisfaction, and r
- Page 143 and 144: social nature within sense of place
- Page 145 and 146: Table 1.—Descriptions of key info
- Page 147 and 148: sharing the place with others and a
- Page 149 and 150: Manzo, L.C. 2005. For better or wor
- Page 151 and 152: NORMATIVE TOLERANCES FOR SCUBA DIVE
- Page 153 and 154: neutral point. Bubbles at the top o
- Page 155 and 156: Table 1.—Snorkeler evaluations of
- Page 157 and 158: Davis, D.; Tisdell, C. 1995. Recrea
- Page 159 and 160: William Valliere University of Verm
- Page 161 and 162: �����������
- Page 163 and 164: Manning, R. 2007. Parks and carryin
- Page 165 and 166: mission is “...to promote and reg
- Page 167 and 168: Figure 1.—Pedestrian walkway LOS
- Page 169 and 170: Acceptability 4 3 2 1 0 -1 -2 -3 -4
- Page 171 and 172: TOURISM TRENDS AND CHALLENGES
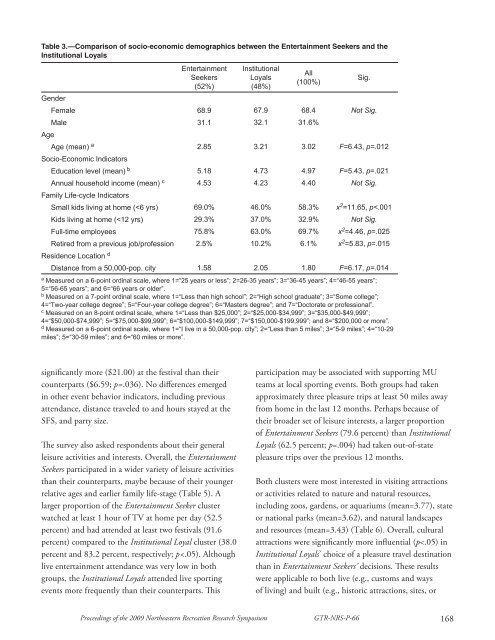
- Page 173: the rankings of 12 attendance motiv
- Page 177 and 178: Table 6.—Entertainment Seekers’
- Page 179 and 180: PLACE MEANINGS
- Page 181 and 182: Stedman (1999) posited that sense o
- Page 183 and 184: points in a focus group session, Ne
- Page 185 and 186: are not shared by current residents
- Page 187 and 188: Ishwar Dhami Division of Forestry a
- Page 189 and 190: Figure 2.—Model for the calculati
- Page 191 and 192: Table 1.—Viewshed results for all
- Page 193 and 194: land implies that planting vegetati
- Page 195 and 196: Shafer, E.L.; Hamilton, J.F.; Schmi
- Page 197 and 198: a setting’s ability to facilitate
- Page 199 and 200: EUH Place Satisfaction Figure 1.—
- Page 201 and 202: Table 4.—Regression coefficients
- Page 203 and 204: Jőreskog, K.G.; Sőrbom, D. 2004.
- Page 205 and 206: OUTDOOR RECREATION II
- Page 207 and 208: Th e primary objective of the propo
- Page 209 and 210: Question 10. Do you believe that SU
- Page 211 and 212: Rodney B. Warnick Tom Stevens Unive
- Page 213 and 214: Table 1.—Estimated visitation to
- Page 215 and 216: Table 2.—Estimated national park
- Page 217 and 218: For this section of the trend analy
- Page 219 and 220: 5.0 DISCUSSION, CONCLUSIONS, AND IM
- Page 221 and 222: RECREATION TRAILS IN MAINE AND NEW
- Page 223 and 224: Table 2.—Average cross-sectional
- Page 225 and 226:
Table 5.—The percentage of stream
- Page 227 and 228:
Demrow, C.C. 2002. Maine trails man
- Page 229 and 230:
Turner, J.M. 2002. From woodcraft t
- Page 231 and 232:
Chad P. Dawson, Professor State Uni
- Page 233 and 234:
80 70 60 50 40 30 20 10 0 Very diss
- Page 235 and 236:
Table 4.—The number of campers in
- Page 237 and 238:
Fuller, C.; Dawson, C. 1999. A comp
- Page 239 and 240:
Table 1.—Modal response rates Ini
- Page 241 and 242:
Smee, A.; Brennan, M. 2000. Electro
- Page 243 and 244:
Table 1.—Characteristics of parti
- Page 245 and 246:
Table 3.—Results of discriminant
- Page 247 and 248:
5.0 CITATIONS Babbie, E. 2001. Th e
- Page 249 and 250:
Bernardita Silva Graduate Assistant
- Page 251 and 252:
Table 1.—Expenditures by 2008 Ame
- Page 253 and 254:
6.0 CITATIONS Della Bitta, A.; Lond
- Page 255 and 256:
the economic impact of travel, and
- Page 257 and 258:
the air show. Th e second most popu
- Page 259 and 260:
not displace other local spending.
- Page 261 and 262:
6.0 CITATIONS Adams, P.D.; Parmente
- Page 263 and 264:
MANAGEMENT AND USE OF PARK, RECREAT
- Page 265 and 266:
which suggests that diff erent type
- Page 267 and 268:
Table 2.—Between-groups ANOVA to
- Page 269 and 270:
forest settings (means = 4.4 and 4.
- Page 271 and 272:
LEISURE RESEARCH
- Page 273 and 274:
communities together, and a decline
- Page 275 and 276:
Table 2.—Life satisfaction scale
- Page 277 and 278:
onds within a social group is a mec
- Page 279 and 280:
“I JUST WANTED TO GET AWAY”: AN
- Page 281 and 282:
Th e importance of “getting away
- Page 283 and 284:
Gerlach, J. 1989. Spring Break at P
- Page 285:
www.nrs.fs.fed.us The U.S. Departme


