Session 1 - Montefiore
Session 1 - Montefiore
Session 1 - Montefiore

You also want an ePaper? Increase the reach of your titles
YUMPU automatically turns print PDFs into web optimized ePapers that Google loves.
transportation represents 11.8% to 31.9% of the consumption of a neighborhood. Public lighting plays a<br />
comparatively minor role in overall energy consumption.<br />
Key factors in the energy performance of suburban neighborhoods<br />
A clear difference is observed between the heating energy requirements of houses and neighborhoods<br />
built before and after the first thermal regulation adopted in the Walloon region. Houses built after the first<br />
regulation annually consume 130 kWh/m² or less, whereas those built before 1980, especially dispersed<br />
houses, annually consume from 235 to 401 kWh/m². For semi-detached and terraced houses, annual energy<br />
consumption falls between 84 and 319 kWh/m² depending on the age of the building. For buildings of the<br />
same age, semi-detached and terraced houses consume 14.6% to 23.6% less energy than detached houses,<br />
highlighting the effect of connectivity on the energy performance of buildings.<br />
The simulations show that adding insulation in the roof and replacing windows by high-performance<br />
glazing (that are the most common upgrades made by home owners) allow to significantly improve the<br />
energy performance of buildings (up to 40% in comparison with a non-insulated house). Adding insulation<br />
in the slab and the walls is also efficient but is more difficult to realize.<br />
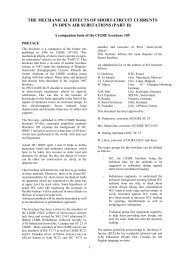
Figure 2 shows heating energy requirements per square meter of the three case studies. The regional<br />
mean, the heating energy requirements of the European Energy Performance of Building Directive and of<br />
the “low energy” and “passive” standards are added to calibrate these results. Energy used for hot water,<br />
appliance (including lighting) and cooking, that is based on the mean regional value and assumed to remain<br />
unchanged, are mentioned on the Figure (light grey section) to delineate its impact on building energy<br />
consumption.<br />
Figure 2: Energy Requirements (kWh/m².year) attributed to Heating (dark grey) and Hot Water,<br />
Electrical Appliance and Cooking (light grey) of the Three Case Studies and Comparison with Regional<br />
Mean and “EPDB”, “Low energy” and “Passive” Standards.<br />
AF. Marique and S. Reiter, 2012. A Method to evaluate the energy consumption of suburban<br />
neighborhoods, HVAC&R Research 18 (1-2), 88-99.<br />
11