Session 1 - Montefiore
Session 1 - Montefiore
Session 1 - Montefiore

You also want an ePaper? Increase the reach of your titles
YUMPU automatically turns print PDFs into web optimized ePapers that Google loves.
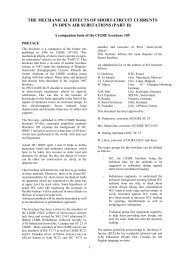
The extent of urban sprawl in Europe<br />
Map 4 Urban sprawl in Germany, Poland and Czech Republic (1990–2000)<br />
Source: EEA, 2005.<br />
0 100 200 Km<br />
we look ahead to the type of Europe we would like<br />
to see in the next 50–100 years, taking into account<br />
possible climate change and the many impacts and<br />
adaptation challenges it would pose (see Chapter 4,<br />
Section 4.1.4).<br />
Historical trends, since the mid-1950s, show that<br />
European cities have expanded on average by<br />
78 %, whereas the population has grown by only<br />
33 %. A major consequence of this trend is that<br />
European cities have become much less compact.<br />
The dense enclosed quarters of the compact city<br />
have been replaced by free standing apartment<br />
blocks, semi-detached and detached houses. In half<br />
of the urban areas studied in the Moland project,<br />
more than 90 % of all residential areas built after<br />
the mid-1950s were low density areas, with less<br />
than 80 % of the land surface covered by buildings,<br />
roads and other structures (Figure 2). Only in 5<br />
of the 24 cities, all in southern or central parts of<br />
Europe, were more than 50 % of new housing areas<br />
(built since the mid-1950s) densely built-up.<br />
Trends towards new low density environments<br />
are also evident in the space consumed per person<br />
in the cities of Europe during the past 50 years<br />
which has more than doubled. In particular, over<br />
the past 20 years the extent of built-up areas in<br />
many western and eastern European countries<br />
has increased by 20 % while the population has<br />
increased by only 6 % (Figure 3).<br />
Time lags and uneven<br />
development<br />
Urban and infrastructure<br />
development<br />
1 to 5 %<br />
5 to 10 %<br />
More than 10 %<br />
Urban zones 1990<br />
More than 50 000<br />
people<br />
Green background index<br />
0 to 60 %<br />
61 to 100 %<br />
No data<br />
Sprawl is greater, and in many cases significantly<br />
greater, than would be expected on the basis of<br />
population growth alone (MOLAND). Only in<br />
Munich and Bilbao has population grown more<br />
rapidly than in the built-up area. Palermo with<br />
50 % growth in population generated more than<br />
200 % growth in the built-up area (Figure 4).<br />
Although the population is decreasing in many<br />
regions of Europe (Map 5 — blue tone), urban<br />
areas are still growing in those areas, notably<br />
Spain, Portugal and some parts of Italy (Map 5<br />
— dark blue tone). Conversely, moderate increases<br />
of population accompanied by a large expansion<br />
of urban areas can be observed in Spain, Portugal,<br />
Ireland and the Netherlands. Major gains of<br />
population (> 10 %, through immigration) can<br />
only be observed in western Germany, where the<br />
average annual expansion of built-up areas is<br />
47 000 ha/year, growth equivalent over 5 years to<br />
the area of Greater Copenhagen.<br />
European cites are also remarkably diverse in<br />
respect of urban residential densities (Figure 5).<br />
Generally, there is a tendency for residential<br />
densities to fall towards the north and west of<br />
Europe, and the five urban areas with residential<br />
densities of at least 10 000 inhabitants/km 2 are all<br />
located in southern or southeastern Europe. There<br />
is no tendency, however, for urban sprawl to vary<br />
with the density of cities, as irrespective of urban<br />
Urban sprawl in Europe 11