Session 1 - Montefiore
Session 1 - Montefiore
Session 1 - Montefiore

You also want an ePaper? Increase the reach of your titles
YUMPU automatically turns print PDFs into web optimized ePapers that Google loves.
Table 3<br />
Distribution of the steel weight within the walls.<br />
Wall designation % of steel<br />
Roof 43<br />
Floor 21<br />
External walls 27<br />
Internal walls 9<br />
aggregates concrete mainly because of transportation. In fact, even<br />
if, in an LCA, the original concrete is produced with recycled<br />
aggregates, the production of cement is the main contributor to all<br />
studied impact categories. It causes approximately 77% of the total<br />
energy use and 88% of the total GWP. The main reason for such<br />
a situation is a large CO2 emission during the calcinations process in<br />
the clinker production and the fossil fuel usage. The contribution of<br />
the aggregate and concrete production and demolition is very<br />
small. The same conclusions are drawn in [9]. At this stage, it is<br />
important to note that the transportation related to the end-of-life<br />
is taken into account with a higher distance for metallic materials<br />
than for non-metallic materials. Even though, the preliminary<br />
conclusion is still the same.<br />
3.2. Comparative analysis in three different locations<br />
3.2.1. Introduction<br />
To be able to draw general conclusions, it is necessary to conduct<br />
a sensitivity analysis of the results to chosen parameters to truly<br />
understand their influence on the final values. Herein, the goal is to<br />
compare the LCA results of a building located in three different<br />
towns and to assess the influence of climate and energy mix. The<br />
following parameters (inputs) are thus not included in the sensitivity<br />
analysis seen the fact that they don’t change the conclusion of<br />
the comparative analysis, although having (for some of them)<br />
a strong influence on the final results:<br />
(1) Transportation modes and distances could differ from one<br />
town to another but as it is only slightly affecting the results, it<br />
is thus not considered in the sensitivity analysis;<br />
(2) The energy mix: different energy mixes for electricity<br />
production will be considered for the three climates but, in one<br />
country, the energy mix will not be modified;<br />
(3) The scenario and envelope composition: naturally, if the<br />
occupation scenario, demanded temperature or insulation type<br />
are modified, the indicators change consequently. Herein those<br />
parameters will be kept constant but the interested reader can<br />
refer to [10] and [11] for more information;<br />
(4) The house configuration, the percentage of windows, the house<br />
plan, the envelope composition and orientation are of course of<br />
Table 4<br />
Manual calculations e Masonry house versus steel house (kWh/m 2 yr).<br />
Masonry Steel<br />
Building Electricity (including cooling<br />
and double flux ventilation)<br />
20.97 21.97<br />
User Electricity 18.79 18.79<br />
Total electricity demand 39.76 40.75<br />
Space heating 44.85 32.38<br />
Ventilation 12.07 12.07<br />
Hot water 5.57 5.57<br />
Total heating demand 62.50 50.02<br />
Heat recovery (double flux ventilation) 9.05 9.05<br />
Total bought energy for heating 53.44 40.97<br />
Total energy demand 102.26 90.77<br />
Total bought energy 93.20 81.72<br />
Without user electricity 74.42 62.93<br />
B. Rossi et al. / Building and Environment 51 (2012) 402e407 405<br />
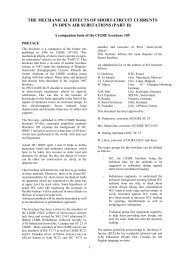
Fig. 3. Manual calculations e Share of eachbuilding part in theEmbodied carbon e Masonry<br />
house versus steel house.<br />
great influence on the final results. They will remain unchanged<br />
in the present sensitivity analysis;<br />
(5) The presence of local heat/electricity production or energy<br />
saving equipment was not investigated in the present paper,<br />
although ventilation heat recovery is taken into account<br />
because it is becoming a common measure in new built house.<br />
Nevertheless, its influence will be briefly discussed;<br />
(6) The carbon payback will be indicated on the next graphs and,<br />
naturally, a modification of the lifespan (50 years until now)<br />
will influence it.<br />
The influence of two important parameters was so therefore<br />
assessed since they might have an influence on the main conclusion<br />
stated before:<br />
(1) The database: The quality (precision, completeness, representativeness)<br />
of the data used can have a significant impact on the<br />
results of an LCA. The existence of uncertainties in input data<br />
and modelling is often mentioned as a crucial drawback to<br />
a clear interpretation of LCA results. First of all, it can be seen<br />
that Equer database (EcoInvent) and the databases used in our<br />
manual calculations provide similar results for the masonry<br />
house (see the companion paper). The uncertainties in the<br />
database yield to tolerable differences as far as these impacts<br />
are concerned. Secondly, the steel embodied emissions initially<br />
taken as EcoInvent ones in Equer, were replaced by the<br />
Worldsteel database (IISI 2002) taking into account the recycling<br />
of steel at the end of its life in our manual calculations<br />
([12] and [13]) It was shown that the end-of-life credits have<br />
a strong influence on the Embodied carbon/energy of the steel<br />
house.<br />
(2) The design of the steel house: It was shown that the quantity of<br />
steel used per HFA, that was initially evaluated as 64 kg/m 2 , can<br />
be increased to approximately 25% of its value, and that, in<br />
order to reach the Embodied carbon of the masonry house.<br />
Similarly, if the design is modified and the steel quantity<br />
increased, the Embodied carbon will increase subsequently in<br />
all climates. It is thus concluded that the design of the house<br />
presented in this analysis does not affect the final conclusion of<br />
the paper.<br />
On top of these considerations, the main conclusions are<br />
provided in the next paragraph which highlight the influence of the<br />
energy mix and climate.