- Page 1 and 2: Session 1 - Supervisors : Pierre De
- Page 3 and 4: Session 3 - Supervisors : Damien Er
- Page 5 and 6: Session 5 - Supervisors : Nathalie
- Page 7 and 8: Session 7 - Supervisors : Pierre De
- Page 9 and 10: Session 9 - Supervisors : Pierre De
- Page 11 and 12: Session 11 - Supervisors : Damien E
- Page 13 and 14: Session 13 - Supervisors : Nathalie
- Page 15 and 16: Session 15 - Supervisors : Sigrid R
- Page 17 and 18: Appendix A : Sigrid Reiter Appendix
- Page 20 and 21: EEA Report No 10/2006 Urban sprawl
- Page 22 and 23: Contents Contents Acknowledgements
- Page 24 and 25: Urban sprawl — a European challen
- Page 26 and 27: from city centres, while retaining
- Page 28 and 29: growth as mentioned in Chapter 1. R
- Page 32 and 33: esidential density, sprawl is equal
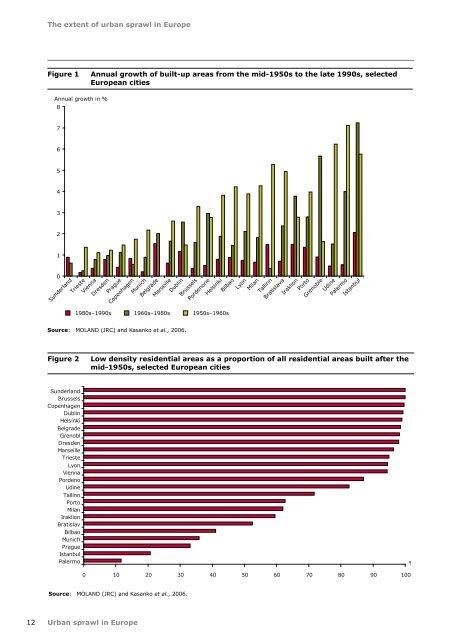
- Page 34 and 35: The extent of urban sprawl in Europ
- Page 36 and 37: 3 The drivers of urban sprawl 3.1 C
- Page 38 and 39: The drivers of urban sprawl Figure
- Page 40 and 41: also clearly demonstrate city spraw
- Page 42 and 43: Box 4 Portugal and Spain: threats t
- Page 44 and 45: Box 5 (cont.) Map Development scena
- Page 46 and 47: Box 6 (cont.) The drivers of urban
- Page 48 and 49: emote locations and requiring trans
- Page 50 and 51: 4.1.2 Natural and protected areas T
- Page 52 and 53: Box 7 (cont.) The impacts of urban
- Page 54 and 55: the societal cost of asthma has bee
- Page 56 and 57: Box 8 Effects of residential areas
- Page 58 and 59: 5.2 The European spatial developmen
- Page 60 and 61: European regional forces generating
- Page 62 and 63: Box 9 (cont.) Responses to urban sp
- Page 64 and 65: urban development plan and focused
- Page 66 and 67: Box 10 (cont.) Responses to urban s
- Page 68 and 69: Annex: Data and methodological appr
- Page 70 and 71: C Assessing urban sprawl at the Eur
- Page 72 and 73: References and further reading Ambi
- Page 74 and 75: European Commission, 1990. Green Pa
- Page 76 and 77: European Environment Agency Urban s
- Page 78 and 79: Appendix A.2 78
- Page 80 and 81:
Section 2 presents a brief review o
- Page 82 and 83:
intervention in these specific type
- Page 84 and 85:
electricity as trains in Belgium ar
- Page 86 and 87:
The majority of those districts are
- Page 88 and 89:
which were calculated with the same
- Page 90 and 91:
The last type of sensitivity analys
- Page 92 and 93:
(INSEE) in France, the Office for N
- Page 94 and 95:
Kints C. La rénovation énergétiq
- Page 96 and 97:
A Method to Evaluate the Energy Con
- Page 98 and 99:
application in many other suburban
- Page 100 and 101:
Our classification of buildings cur
- Page 102 and 103:
to work and the mode of transportat
- Page 104 and 105:
energy consumption of a neighborhoo
- Page 106 and 107:
transportation represents 11.8% to
- Page 108 and 109:
most important. Insulating only the
- Page 110 and 111:
savings highlighted in the first an
- Page 112 and 113:
measurements because of high variat
- Page 114 and 115:
Hilderson, W., E. Mlecnik and J. Cr
- Page 116 and 117:
FIGURE CAPTIONS AND TABLE TITLES Fi
- Page 118 and 119:
PLEA2012 - 28th Conference, Opportu
- Page 120 and 121:
PLEA2012 - 28th Conference, Opportu
- Page 122 and 123:
PLEA2012 - 28th Conference, Opportu
- Page 124 and 125:
PLEA2012 - 28th Conference, Opportu
- Page 126 and 127:
ENERGY REQUIREMENTS AND SOLAR AVAIL
- Page 128 and 129:
year are 34.9 °C and -9,1°C. The
- Page 130 and 131:
The new built density of the neighb
- Page 132 and 133:
Appendix A.6 132
- Page 134 and 135:
uilding” approach. A large amount
- Page 136 and 137:
C. Comparison of our classification
- Page 138:
In fact, as cavity walls became wid
- Page 141 and 142:
METHODS, TOOLS, AND SOFTWARE Keywor
- Page 143 and 144:
approaches. These methodologies hav
- Page 145 and 146:
travel through the urban area of Li
- Page 147 and 148:
METHODS, TOOLS, AND SOFTWARE Figure
- Page 149 and 150:
as well as the ability to test fore
- Page 151 and 152:
Appendix A.8 151
- Page 153 and 154:
consumption is rarely taken into ac
- Page 155 and 156:
interdependences between urban stru
- Page 157 and 158:
These data were also used by Boussa
- Page 159 and 160:
and energy consumption in the resid
- Page 161 and 162:
Mean modal share (train) 14,0% 12,7
- Page 163 and 164:
Figure 4: Annual transport energy c
- Page 165 and 166:
23,0%, even if the annual energy co
- Page 167 and 168:
or commercial purposes. “Type-pro
- Page 169 and 170:
Beevers SD and Carslaw DC (2005) Th
- Page 171 and 172:
Lavadinho S and Lensel B (2010) Imp
- Page 173 and 174:
Appendix A.9 173
- Page 175 and 176:
NOTICE The submitted manuscript has
- Page 177 and 178:
Using ZEB design goals takes us out
- Page 179 and 180:
Boulder, Colorado has a solar acces
- Page 181 and 182:
(Mermoud 1996) to calculate the exp
- Page 183 and 184:
energy is used. TDVs have been deve
- Page 185 and 186:
Net Zero Energy Emissions Building
- Page 187 and 188:
combined with selecting a favorable
- Page 189 and 190:
Appendix A.10 189
- Page 191 and 192:
Life Cycle Assessment of Buildings
- Page 193 and 194:
Life Cycle Assessment of Buildings
- Page 195 and 196:
Life Cycle Assessment of Buildings
- Page 197 and 198:
Life Cycle Assessment of Buildings
- Page 199 and 200:
Life Cycle Assessment of Buildings
- Page 201 and 202:
Life Cycle Assessment of Buildings
- Page 203 and 204:
Life Cycle Assessment of Buildings
- Page 205 and 206:
Life Cycle Assessment of Buildings
- Page 207 and 208:
PRe, SimaPro., 2000. Life Cycle Ass
- Page 209 and 210:
Appendix A.11 209
- Page 211 and 212:
396 buildings [17,26]. This review
- Page 213 and 214:
398 2.2. Embodied energy and carbon
- Page 215 and 216:
400 using photovoltaic panels will
- Page 217 and 218:
Appendix A.12 217
- Page 219 and 220:
assumptions, the indicators (Embodi
- Page 221 and 222:
Table 3 Distribution of the steel w
- Page 223 and 224:
the three case studies exhibit a st
- Page 225 and 226:
PLEA 2011 - 27 th Conference on Pas
- Page 227 and 228:
PLEA 2011 - 27 th Conference on Pas
- Page 229 and 230:
PLEA 2011 - 27 th Conference on Pas
- Page 231 and 232:
Appendix B : Pierre Dewallef Append
- Page 233 and 234:
When writing your presentation, you
- Page 235 and 236:
Status of Solar Tower Power Plant t
- Page 237 and 238:
Appendix B.3 237
- Page 239 and 240:
When writing your presentation, you
- Page 241 and 242:
Status of biomass combustion power
- Page 243 and 244:
Appendix B.5 243
- Page 245 and 246:
When writing your presentation, you
- Page 247 and 248:
Status of ocean thermal energy conv
- Page 249 and 250:
Appendix B.7 249
- Page 251 and 252:
When writing your presentation, you
- Page 253 and 254:
Status of Natural Gas Combined Cycl
- Page 255 and 256:
Appendix B.9 255
- Page 257 and 258:
When writing your presentation, you
- Page 259 and 260:
Status of Integrated coal Gazeifica
- Page 261 and 262:
Appendix B.11 261
- Page 263 and 264:
When writing your presentation, you
- Page 265 and 266:
Status of Carbon Capture and Storag
- Page 267 and 268:
Appendix B.13 267
- Page 269 and 270:
When writing your presentation, you
- Page 271 and 272:
Status of Carbon Capture and Storag