Session 1 - Montefiore
Session 1 - Montefiore
Session 1 - Montefiore

Create successful ePaper yourself
Turn your PDF publications into a flip-book with our unique Google optimized e-Paper software.
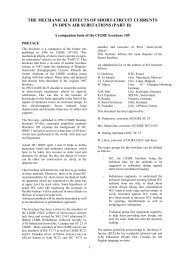
travel through the urban area of Liège (IPE in kilowatt-hours<br />
per student for a one-way trip to school). This map shows that<br />
peripheral areas tend to generate much more energy consumption<br />
than the central areas of the urban zone.<br />
The method used to assess residential energy consumption<br />
for buildings and transport is developed and tested for Walloon<br />
cities, but it is transposable to other regions and cities. Input<br />
data for buildings and transportation models come from national<br />
surveys or are collected using a GIS, which are both commonly<br />
used tools in numerous regions and countries. Surveys similar to<br />
the one used in our model are carried out by, for example, the<br />
French National Institute of Statistics (INSEE) in France, the<br />
Office for National Statistics (ONS) in the United Kingdom,<br />
and the Census and Statistics of Population (IDESCAT) in<br />
Catalonia, whereas GISs oriented toward urban planning are<br />
now largely used by researchers and territorial communities. It<br />
would be interesting to apply the developed method to other<br />
case studies of differing urban and transport system layouts to<br />
compare their performance.<br />
Modeling Energy Consumption at the<br />
City Scale<br />
The city energy modeling is organized into two areas: residential<br />
building energy consumption and transport energy consumption<br />
of residents.<br />
Residential Building Energy Consumption<br />
For the first topic, a typology of Liège’s residential building<br />
stock is drawn up by crossing the four chosen building energy<br />
criteria: building date of construction, building renovation, type<br />
of building, and type of housing. Note that the urban area of<br />
Liège has 64,079 terraced houses, 52,314 semidetached houses,<br />
32,478 detached houses, and 13,897 community buildings.<br />
Energy consumption (including heating, hot water, and<br />
lighting) is known for each of these types of buildings through<br />
empirical surveys on the Walloon building stock (CEEW 2007;<br />
ICEDD 2005; Kints 2008). Cooling requirements were neglected<br />
because they are minimal in Belgium. In fact, these<br />
empirical surveys show that heating represents the largest part of<br />
the overall energy consumption of Belgian households (76%).<br />
Home appliances, the production of hot water, and cooking<br />
represent 10%, 11%, and 3% of the total, respectively. The energy<br />
requirements of residential buildings at the city scale were<br />
calculated by adding the results from the energy consumption<br />
analysis for each type of house according to their distribution<br />
in the urban area of Liège.<br />
When these values are related to each building, it is possible<br />
to establish the actual residential building energy use at the city<br />
scale. Moreover, on the basis of the cadaster, we can study the<br />
evolution of the energy consumption of the whole urban area<br />
of Liège since 1850, which is the first date of construction of<br />
a building identified in the cadaster (see figure 2). Before 1931<br />
the dates of building construction are aggregated for periods<br />
METHODS, TOOLS, AND SOFTWARE<br />
Figure 2 Evolution of the energy consumption of the urban area<br />
of Liège (in gigawatt-hours per year [GWh/year]).<br />
lasting from 20 to 25 years, which explains the larger width of<br />
the bars in that portion of figure 2. This graph shows a very high<br />
growth of energy consumption in Liège’s urban area during the<br />
last century, reaching 6,048 gigawatt-hours (GWh) for the year<br />
2010. 2<br />
Transport Energy Consumption of Residents<br />
For modeling transport energy consumption, we followed<br />
the methodology developed by Marique and Reiter (2012a),<br />
using values available in each census block about car ownership,<br />
travel distances, main mode of transport used, and the number<br />
of working days per week and per worker, among others. We<br />
have considered the two last Belgian censuses.<br />
The annual consumption of a worker or a student is obtained<br />
by the following calculation:<br />
IPE × annual number of trips (to work or school),<br />
assuming 253 working days per year and 180 school days per<br />
year. Finally, the annual consumption calculated for a person<br />
is multiplied by the number of workers or students in the area,<br />
giving for 2010 a global value for residential transport consumption<br />
of 941.9 GWh, from which 841.6 GWh are due to<br />
home-to-work travel and 100.3 GWh to home-to-school travel.<br />
Reiter and Marique, Toward Low Energy Cities 5