Session 1 - Montefiore
Session 1 - Montefiore
Session 1 - Montefiore

You also want an ePaper? Increase the reach of your titles
YUMPU automatically turns print PDFs into web optimized ePapers that Google loves.
METHODS, TOOLS, AND SOFTWARE<br />
• Type of building (two, three, or four frontages). Indeed,<br />
for the same level of insulation, a terraced house uses less<br />
energy for heating than a detached house (Marique and<br />
Reiter 2012b). These data are available in the cadaster.<br />
• Type of housing (collective or individual). These data are<br />
available in the cadaster.<br />
• Index of energy performance for residents’ transport for<br />
home-to-work travel. This index has been developed by<br />
Marique and Reiter (2012a) for the Walloon region.<br />
• Index of energy performance for residents’ transport for<br />
home-to-school travels. This index has been developed<br />
by Marique and Reiter (2012a) for the Walloon region.<br />
The “energy performance index” (IPE) represents the energy<br />
used by one person for one trip from home to destination (in<br />
kilowatt-hours per person per trip [kWh/person/trip]). It takes<br />
into account the distances travelled, the means of transport<br />
used, and their relative consumption rates. The IPE is calculated<br />
according to equation (1),<br />
� � ��<br />
Energy performance index (i ) = mDmi × fm Ti ,<br />
(1)<br />
where i represents the territorial unit; m is the means of transport<br />
used (diesel car, fuel car, train, bus, bike, on foot); Dmi is the<br />
total distance travelled by the means of transport m in the<br />
district i for home-to-work (or home-to-school) travels; fm is the<br />
consumption factor attributed to the means of transport m;and<br />
Ti is the number of workers (or students) in the territorial unit i.<br />
Consumption factors (fm) used in this article were calculated for<br />
the Walloon region of Belgium by Marique and Reiter (2012a)<br />
on the basis of regional and local data: 0.61 kilowatt-hours per<br />
person per kilometer (kWh/person/km) for a diesel car, 0.56<br />
kWh/person/km for a fuel car, 0.45 kWh/person/km for a bus,<br />
0.15 kWh/person/km for a train, and 0 for nonmotorized means<br />
of transportation because these do not consume any energy. 1<br />
The two transport indexes are based on statistical data coming<br />
from national censuses, carried out every ten years in Belgium.<br />
These data are available at the census block scale for the<br />
survey carried out in 1991 and at the individual scale for the last<br />
survey carried out in 2001. It should be noted that the transport<br />
data based on the first national survey in 1991 are less accurate<br />
than the buildings data, based on the cadastral values known<br />
for each building, because of the assumption that statistical data<br />
are evenly distributed in each census block. Nevertheless, these<br />
data are sufficiently accurate for a study at the city scale.<br />
The result of this cartographic work is the spatialization of<br />
the six chosen energy criteria through the urban area of Liège.<br />
More details on how the GIS was used can be found in the<br />
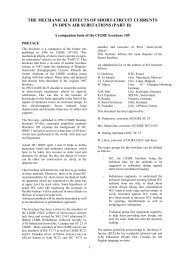
work of Wallemacq and colleagues (2011). Figure 1 presents the<br />
mapping of the index of energy performance for home-to-school<br />
Figure 1 Mapping of the index of energy performance for home-to-school travel (IPE, in kilowatt-hours per worker [kWh/worker] for a<br />
one-way trip to school) through the urban area of Liège.<br />
4 Journal of Industrial Ecology