Scuola di Dottorato di Ricerca in Parodontologia Sperimentale
Scuola di Dottorato di Ricerca in Parodontologia Sperimentale
Scuola di Dottorato di Ricerca in Parodontologia Sperimentale

Create successful ePaper yourself
Turn your PDF publications into a flip-book with our unique Google optimized e-Paper software.
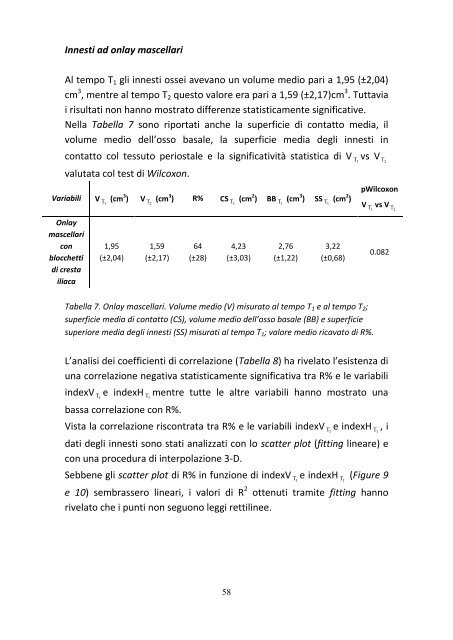
Innesti ad onlay mascellari<br />
Al tempo T1 gli <strong>in</strong>nesti ossei avevano un volume me<strong>di</strong>o pari a 1,95 (±2,04)<br />
cm 3 , mentre al tempo T2 questo valore era pari a 1,59 (±2,17)cm 3 . Tuttavia<br />
i risultati non hanno mostrato <strong>di</strong>fferenze statisticamente significative.<br />
Nella Tabella 7 sono riportati anche la superficie <strong>di</strong> contatto me<strong>di</strong>a, il<br />
volume me<strong>di</strong>o dell’osso basale, la superficie me<strong>di</strong>a degli <strong>in</strong>nesti <strong>in</strong><br />
contatto col tessuto periostale e la significatività statistica <strong>di</strong> V T vs V 1 T2<br />
valutata col test <strong>di</strong> Wilcoxon.<br />
Variabili V T (cm<br />
1<br />
3 ) V T (cm<br />
2<br />
3 ) R% CS T (cm<br />
1<br />
2 ) BB T (cm<br />
1<br />
3 ) SS T (cm<br />
1<br />
2 )<br />
Onlay<br />
mascellari<br />
con<br />
blocchetti<br />
<strong>di</strong> cresta<br />
iliaca<br />
1,95<br />
(±2,04)<br />
1,59<br />
(±2,17)<br />
64<br />
(±28)<br />
4,23<br />
(±3,03)<br />
58<br />
2,76<br />
(±1,22)<br />
3,22<br />
(±0,68)<br />
Tabella 7. Onlay mascellari. Volume me<strong>di</strong>o (V) misurato al tempo T1 e al tempo T2;<br />
superficie me<strong>di</strong>a <strong>di</strong> contatto (CS), volume me<strong>di</strong>o dell’osso basale (BB) e superficie<br />
superiore me<strong>di</strong>a degli <strong>in</strong>nesti (SS) misurati al tempo T1; valore me<strong>di</strong>o ricavato <strong>di</strong> R%.<br />
pWilcoxon<br />
V T vs V<br />
1 T 2<br />
0.082<br />
L’analisi dei coefficienti <strong>di</strong> correlazione (Tabella 8) ha rivelato l’esistenza <strong>di</strong><br />
una correlazione negativa statisticamente significativa tra R% e le variabili<br />
<strong>in</strong>dexV T e <strong>in</strong>dexH 1<br />
T mentre tutte le altre variabili hanno mostrato una<br />
1<br />
bassa correlazione con R%.<br />
Vista la correlazione riscontrata tra R% e le variabili <strong>in</strong>dexV T e <strong>in</strong>dexH 1<br />
T , i 1<br />
dati degli <strong>in</strong>nesti sono stati analizzati con lo scatter plot (fitt<strong>in</strong>g l<strong>in</strong>eare) e<br />
con una procedura <strong>di</strong> <strong>in</strong>terpolazione 3-D.<br />
Sebbene gli scatter plot <strong>di</strong> R% <strong>in</strong> funzione <strong>di</strong> <strong>in</strong>dexV 1<br />
T e <strong>in</strong>dexH 1<br />
T (Figure 9<br />
e 10) sembrassero l<strong>in</strong>eari, i valori <strong>di</strong> R 2 ottenuti tramite fitt<strong>in</strong>g hanno<br />
rivelato che i punti non seguono leggi rettil<strong>in</strong>ee.