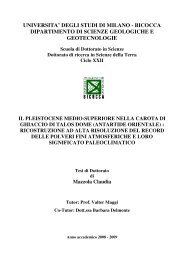
R% CS T 1 SS T 1 BB T 1 R% CS T 1 SS T 1 63 BB T 1 <strong>in</strong>dexV T 1 <strong>in</strong>dexH T 1 <strong>in</strong>dexS T 1 c. coefficient 1 0,6571 0,8286 0,9429 -0,0286 0,3143 -0,8429 Sig. (two-tailed) 0,175 0,0583 0,0167 1 0,5639 0,0429 N 6 6 6 6 6 6 6 c. coefficient 0,6571 1 0,6571 0,7714 -0,0286 -0,0286 0,0857 Sig. (two-tailed) 0,175 0,175 0,1028 1 1 0,9194 N 6 6 6 6 6 6 6 c. coefficient 0,8286 0,6571 1 0,7714 -0,3714 0,6571 -0,0857 Sig. (two-tailed) 0,0583 0,175 0,1028 0,4972 0,175 0,9194 N 6 6 6 6 6 6 6 c. coefficient 0,9429 0,7714 0,7714 1 0,0857 0,2571 -0,4857 Sig. (two-tailed) 0,0167 0,1028 0,1028 0,9194 0,6583 0,3556 <strong>in</strong>dexV T 1 N 6 6 6 6 6 6 6 c. coefficient -0,0286 -0,0286 -0,3741 0,0857 1 -0,5429 0,5429 Sig. (two-tailed) 1 1 0,4972 0,9194 0,2972 0,2972 <strong>in</strong>dexH T 1 N 6 6 6 6 6 6 6 c. coefficient 0,3143 -0,0286 0,6571 0,2571 -0,5429 1 0,0286 Sig. (two-tailed) 0,5639 1 0,175 0,6583 0,2972 1 <strong>in</strong>dexS T 1 N 6 6 6 6 6 6 6 c. coefficient -0,8429 0,0857 -0,0857 -0,4857 -0,5429 0,0286 1 Sig. (two-tailed) 0,0429 0,9194 0,9194 0,3556 0,2972 1 N 6 6 6 6 6 6 6 Tabella 10. Onlay man<strong>di</strong>bolari. Coefficienti <strong>di</strong> Spearman tra tutte le variabili misurate e derivate (R%, CST1, SST1, BBT1, <strong>in</strong>dexVT1, <strong>in</strong>dexHT1 e <strong>in</strong>dexST1) con un livello <strong>di</strong> significatività (evidenziato <strong>in</strong> rosso) settato al 5%.
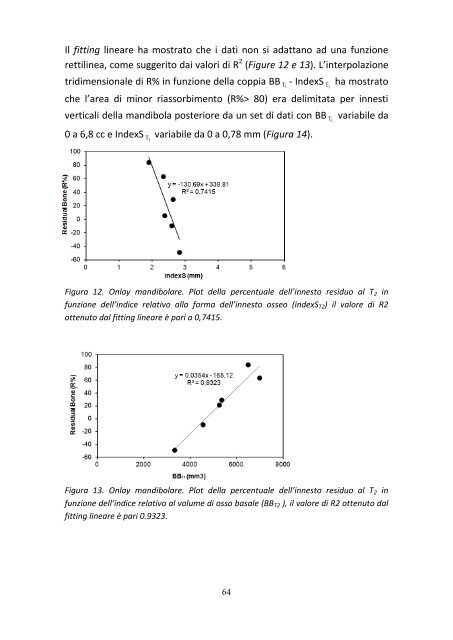
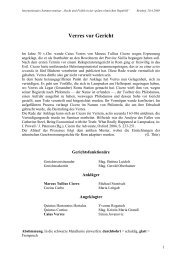
Il fitt<strong>in</strong>g l<strong>in</strong>eare ha mostrato che i dati non si adattano ad una funzione rettil<strong>in</strong>ea, come suggerito dai valori <strong>di</strong> R 2 (Figure 12 e 13). L’<strong>in</strong>terpolazione tri<strong>di</strong>mensionale <strong>di</strong> R% <strong>in</strong> funzione della coppia BB T - IndexS 1 T ha mostrato 1 che l’area <strong>di</strong> m<strong>in</strong>or riassorbimento (R%> 80) era delimitata per <strong>in</strong>nesti verticali della man<strong>di</strong>bola posteriore da un set <strong>di</strong> dati con BB T variabile da 1 0 a 6,8 cc e IndexS T variabile da 0 a 0,78 mm (Figura 14). 1 Figura 12. Onlay man<strong>di</strong>bolare. Plot della percentuale dell’<strong>in</strong>nesto residuo al T2 <strong>in</strong> funzione dell’<strong>in</strong><strong>di</strong>ce relativo alla forma dell’<strong>in</strong>nesto osseo (<strong>in</strong>dexST2) il valore <strong>di</strong> R2 ottenuto dal fitt<strong>in</strong>g l<strong>in</strong>eare è pari a 0,7415. Figura 13. Onlay man<strong>di</strong>bolare. Plot della percentuale dell’<strong>in</strong>nesto residuo al T2 <strong>in</strong> funzione dell’<strong>in</strong><strong>di</strong>ce relativo al volume <strong>di</strong> osso basale (BBT2 ), il valore <strong>di</strong> R2 ottenuto dal fitt<strong>in</strong>g l<strong>in</strong>eare è pari 0.9323. 64
- Page 1 and 2:
UNIVERSITÀ DEGLI STUDI MILANO-BICO
- Page 3 and 4:
Indice Introduzione 6 Il riassorbim
- Page 5 and 6:
Figura 12. 64 Figura 13. 64 Figura
- Page 7 and 8:
Introduzione Negli ultimi quindici
- Page 9 and 10:
Il riassorbimento dei mascellari ed
- Page 11 and 12:
Modelli di riassorbimento delle oss
- Page 13 and 14: Classificazione della densità osse
- Page 15 and 16: Il trattamento chirurgico dei masce
- Page 17 and 18: Innesti ossei Gli innesti ossei son
- Page 19 and 20: osteoconduzione, osteoinduzione ed
- Page 21 and 22: dalle pareti del sito ricevente che
- Page 23 and 24: Sito ricevente Il sito ricevente gi
- Page 25 and 26: Principali siti di prelievo dell’
- Page 27 and 28: Prelievo da cresta iliaca I primi a
- Page 29 and 30: dello sportello. Esso poggerà su d
- Page 31 and 32: Gli innesti di apposizione vertical
- Page 33 and 34: Obiettivi dello studio Fase Clinico
- Page 35 and 36: Sinus Lift Prima dell’intervento,
- Page 37 and 38: Gli impianti inseriti erano endosse
- Page 39 and 40: Metodica di calcolo di volumi e are
- Page 41 and 42: Per una sovrapposizione teorica di
- Page 43 and 44: Figura 3. Operazione di reformat ne
- Page 45 and 46: Variabili misurate e derivate Per v
- Page 47 and 48: Correlazione, fitting e interpolazi
- Page 49 and 50: Materiali e metodi Fase Analisi Gen
- Page 51 and 52: È stato calcolato il numero di cit
- Page 53 and 54: Risultati Fase Chirurgico-Radiologi
- Page 55 and 56: Sinus Lift Al tempo T1 gli innesti
- Page 57 and 58: Figura 6. Sinus lift. Plot della pe
- Page 59 and 60: Innesti ad onlay mascellari Al temp
- Page 61 and 62: Figura 9. Onlay mascellari. Plot de
- Page 63: Innesti ad onlay mandibolari I valo
- Page 67 and 68: Risultati Fase Analisi Genica La pr
- Page 69 and 70: Figura 17: Geni appartenenti al clu
- Page 71 and 72: È stato individuato solo un gene a
- Page 73 and 74: Nome gene Nome ufficiale 72 gsc (n)
- Page 75 and 76: Discussioni Fase Clinico-radiografi
- Page 77 and 78: interpolazione, che hanno indicato
- Page 79 and 80: Discussioni Fase Analisi Genica Num
- Page 81 and 82: Membro della superfamiglia delle ci
- Page 83 and 84: incremento osseo. In questa seconda
- Page 85 and 86: VEGFA è pari a 20.4%, nel cluster
- Page 87 and 88: Per tutti i tipi di innesto, è sta
- Page 89 and 90: elseif ((100
- Page 91 and 92: Nmax=sequenceEndNo; dec=1; inc=1; %
- Page 93 and 94: C01=(round(B01)); if C01(1) >= 1 &&
- Page 95 and 96: Appendice C function CORD=TRIPLANE4
- Page 97 and 98: Appendice D Consideriamo quindi nel
- Page 99 and 100: % DOMAIN is equivalent to the struc
- Page 101 and 102: elseif (nargin == 5) s = varargin{4
- Page 103 and 104: if T1(q) > size(T,1) T1(q)=T1(q)-si
- Page 105 and 106: placed in partially edentulous pati
- Page 107 and 108: 35. Smolka W, Eggensperger N, Carol
- Page 109 and 110: 56. Baughn LB, Di Liberto M, Niesvi