
Create successful ePaper yourself
Turn your PDF publications into a flip-book with our unique Google optimized e-Paper software.
GNGTS 2009 SESSIONE <strong>2.3</strong><br />
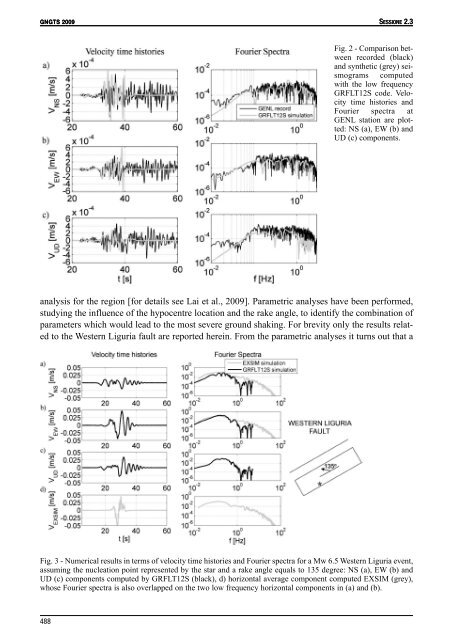
Fig. 2 - Comparison between<br />
recorded (black)<br />
and synthetic (grey) seismograms<br />
computed<br />
with the low frequency<br />
GRFLT12S code. Velocity<br />
time histories and<br />
Fourier spectra at<br />
GENL station are plotted:<br />
NS (a), EW (b) and<br />
UD (c) components.<br />
analysis for the region [for details see Lai et al., 2009]. Parametric analyses have been performed,<br />
studying the influence of the hypocentre location and the rake angle, to identify the combination of<br />
parameters which would lead to the most severe ground shaking. For brevity only the results related<br />
to the Western Liguria fault are reported herein. From the parametric analyses it turns out that a<br />
Fig. 3 - Numerical results in terms of velocity time histories and Fourier spectra for a Mw 6.5 Western Liguria event,<br />
assuming the nucleation point represented by the star and a rake angle equals to 135 degree: NS (a), EW (b) and<br />
UD (c) components computed by GRFLT12S (black), d) horizontal average component computed EXSIM (grey),<br />
whose Fourier spectra is also overlapped on the two low frequency horizontal components in (a) and (b).<br />
488