

A Semi-Implicit, Three-Dimensional Model for Estuarine ... - USGS
A Semi-Implicit, Three-Dimensional Model for Estuarine ... - USGS
A Semi-Implicit, Three-Dimensional Model for Estuarine ... - USGS

Create successful ePaper yourself
Turn your PDF publications into a flip-book with our unique Google optimized e-Paper software.
5. Numerical Experiments 117<br />
Each test simulation <strong>for</strong> the tidal problem is run <strong>for</strong> a total of six days (144 hours). This allows sufficient time <strong>for</strong> any solution<br />
instabilities to appear. The results of each simulation are presented at the location x = 180,000 ft (55 km) from the seaward bound-<br />
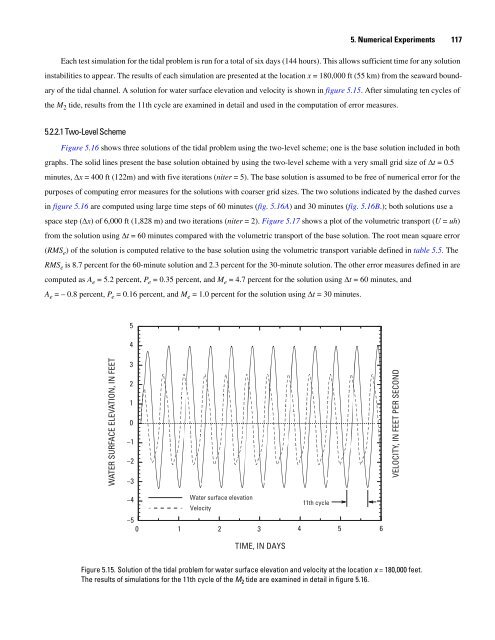
ary of the tidal channel. A solution <strong>for</strong> water surface elevation and velocity is shown in figure 5.15. After simulating ten cycles of<br />
the M 2 tide, results from the 11th cycle are examined in detail and used in the computation of error measures.<br />
5.2.2.1 Two-Level Scheme<br />
Figure 5.16 shows three solutions of the tidal problem using the two-level scheme; one is the base solution included in both<br />
graphs. The solid lines present the base solution obtained by using the two-level scheme with a very small grid size of Δt = 0.5<br />
minutes, Δx = 400 ft (122m) and with five iterations (niter = 5). The base solution is assumed to be free of numerical error <strong>for</strong> the<br />
purposes of computing error measures <strong>for</strong> the solutions with coarser grid sizes. The two solutions indicated by the dashed curves<br />
in figure 5.16 are computed using large time steps of 60 minutes (fig. 5.16A) and 30 minutes (fig. 5.16B.); both solutions use a<br />
space step (Δx) of 6,000 ft (1,828 m) and two iterations (niter = 2). Figure 5.17 shows a plot of the volumetric transport (U = uh)<br />
from the solution using Δt = 60 minutes compared with the volumetric transport of the base solution. The root mean square error<br />
(RMS e) of the solution is computed relative to the base solution using the volumetric transport variable defined in table 5.5. The<br />
RMS e is 8.7 percent <strong>for</strong> the 60-minute solution and 2.3 percent <strong>for</strong> the 30-minute solution. The other error measures defined in are<br />
computed as A e = 5.2 percent, P e = 0.35 percent, and M e = 4.7 percent <strong>for</strong> the solution using Δt = 60 minutes, and<br />
A e = – 0.8 percent, P e = 0.16 percent, and M e = 1.0 percent <strong>for</strong> the solution using Δt = 30 minutes.<br />
WATER SURFACE ELEVATION, IN FEET<br />
5<br />
4<br />
3<br />
2<br />
1<br />
0<br />
−1<br />
−2<br />
−3<br />
−4<br />
−5<br />
Water surface elevation<br />
Velocity<br />
0 1 2<br />
3<br />
4 5 6<br />
TIME, IN DAYS<br />
11th cycle<br />
Figure 5.15. Solution of the tidal problem <strong>for</strong> water surface elevation and velocity at the location x = 180,000 feet.<br />
The results of simulations <strong>for</strong> the 11th cycle of the M 2 tide are examined in detail in figure 5.16.<br />
VELOCITY, IN FEET PER SECOND


