

A Semi-Implicit, Three-Dimensional Model for Estuarine ... - USGS
A Semi-Implicit, Three-Dimensional Model for Estuarine ... - USGS
A Semi-Implicit, Three-Dimensional Model for Estuarine ... - USGS

Create successful ePaper yourself
Turn your PDF publications into a flip-book with our unique Google optimized e-Paper software.
DISTANCE FROM BOTTOM, IN METERS<br />
12<br />
10<br />
8<br />
6<br />
4<br />
2<br />
0<br />
Bottom<br />
Node i = 13, j = 5 (mid-basin)<br />
t = 3.125 hours<br />
t = 6.250 hours<br />
t = 12.500 hours<br />
t = 15.625 hours<br />
t = 9.375 hours t = 18.750 hours<br />
Leendertse and Liu (1977)<br />
<strong>Semi</strong>-implicit, leapfrog scheme<br />
-12 -9 -6 -3 0 3 6 9 12<br />
u VELOCITY COMPONENT, IN CENTIMETERS PER SECOND<br />
5. Numerical Experiments 141<br />
Surface<br />
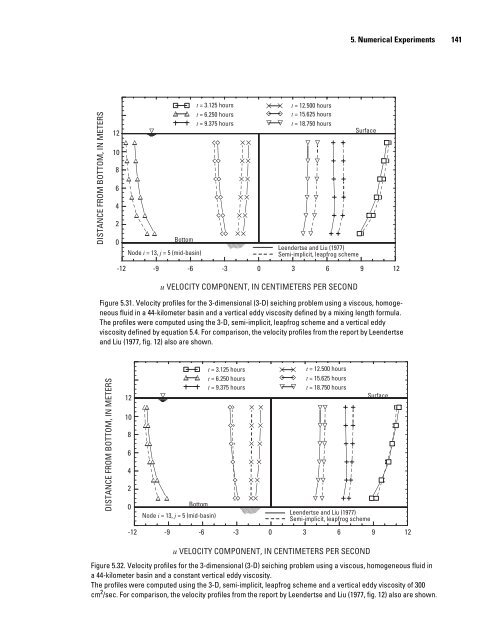
Figure 5.31. Velocity profiles <strong>for</strong> the 3-dimensional (3-D) seiching problem using a viscous, homogeneous<br />
fluid in a 44-kilometer basin and a vertical eddy viscosity defined by a mixing length <strong>for</strong>mula.<br />
The profiles were computed using the 3-D, semi-implicit, leapfrog scheme and a vertical eddy<br />
viscosity defined by equation 5.4. For comparison, the velocity profiles from the report by Leendertse<br />
and Liu (1977, fig. 12) also are shown.<br />
DISTANCE FROM BOTTOM, IN METERS<br />
12<br />
10<br />
8<br />
6<br />
4<br />
2<br />
0<br />
Bottom<br />
Node i = 13, j = 5 (mid-basin)<br />
t = 3.125 hours<br />
t = 12.500 hours<br />
t = 6.250 hours<br />
t = 15.625 hours<br />
t = 9.375 hours t = 18.750 hours<br />
Leendertse and Liu (1977)<br />
<strong>Semi</strong>-implicit, leapfrog scheme<br />
Surface<br />
-12 -9 -6 -3 0 3 6 9 12<br />
u VELOCITY COMPONENT, IN CENTIMETERS PER SECOND<br />
Figure 5.32. Velocity profiles <strong>for</strong> the 3-dimensional (3-D) seiching problem using a viscous, homogeneous fluid in<br />
a 44-kilometer basin and a constant vertical eddy viscosity.<br />
The profiles were computed using the 3-D, semi-implicit, leapfrog scheme and a vertical eddy viscosity of 300<br />
cm 2 /sec. For comparison, the velocity profiles from the report by Leendertse and Liu (1977, fig. 12) also are shown.


