- Page 1 and 2:
State Party: Ukraine Slovak Republi
- Page 3 and 4:
Northern slope of Mt. Pip Ivan and
- Page 5 and 6:
5 A4 size map of nominated property
- Page 7 and 8:
Criteria under which property is no
- Page 9 and 10:
necromass, hollow nesting birds dep
- Page 11 and 12:
Name and contact information of off
- Page 13 and 14:
1.e Maps and plans, showing the bou
- Page 15 and 16:
type - beginning since 10-12% in th
- Page 17 and 18:
Amphibian are represented here by R
- Page 19 and 20:
deciduous tree species in Slovakia,
- Page 21 and 22:
taxoso-mercurialidosum, Fagetum fes
- Page 23 and 24:
2.a.4 Maramorosh (Ukraine) Abiotic
- Page 25 and 26:
ird fauna of the cluster is very pe
- Page 27 and 28:
depauperate appearance due to the v
- Page 29 and 30:
forests complex contains some 200 y
- Page 31 and 32:
2.a.7 Stuzhytsia − Uzhok (Ukraine
- Page 33 and 34:
one. Gonepteryx rhamni, Nymphalis a
- Page 35 and 36:
Fagetum dentariosum and Fagetum spa
- Page 37 and 38:
2.a.9 Uholka-Shyrokyi Luh (Ukraine)
- Page 39 and 40:
The beech forests with an admixture
- Page 41 and 42:
2.a.10 Vihorlat (Slovak Republic) A
- Page 43 and 44:
2.b History and Development: Forest
- Page 45 and 46:
Due to it, the buffer zone of the C
- Page 47 and 48:
Within the territory of the Uzhansk
- Page 49 and 50:
3. Justification of Inscription The
- Page 51 and 52:
illustrated by the inventory data o
- Page 53 and 54:
Tab. 4: Dynamics of number of Myoti
- Page 55 and 56:
close-to-nature forestry on the glo
- Page 57 and 58:
nomination by Polish beech primeval
- Page 59 and 60:
world natural heritage list within
- Page 61 and 62:
3.d Integrity and Authenticity Auth
- Page 63 and 64:
and LeGoff (1992) once presented a
- Page 65 and 66:
4.a.5 Rožok (Slovak Republic) Sinc
- Page 67 and 68:
Government of SR No. 216/1998. Give
- Page 69 and 70:
Nominated properties are situated o
- Page 71 and 72:
5. Protection and Management of the
- Page 73 and 74:
protection of the massifs on the Uk
- Page 75 and 76:
territorial development plans and a
- Page 77 and 78:
technological innovations with the
- Page 79 and 80:
5.j Staffing levels (professional,
- Page 81 and 82:
Chemical composition of precipitati
- Page 83 and 84:
National Academy of Sciences, Feder
- Page 85 and 86:
4 Print Havešová 2002 TU Zvolen n
- Page 87 and 88:
Rakhiv, Transcarpathian Region Ukra
- Page 89 and 90:
BRANG, P., 2005: Virgin Forests as
- Page 91 and 92:
HODOVANETS B.YO Distribution and nu
- Page 93 and 94:
LUHOVOI A.E. Birds // Fauna of the
- Page 95 and 96:
PIOVESAN, G., DI FILIPPO, A., ALESS
- Page 97 and 98:
VOLOŠČUK, I., 1999: National Park
- Page 99 and 100:
Transcarpathian Region, Ukraine Tel
- Page 101:
9. Signature on behalf of the State
- Page 119 and 120:
inscription onto the UNESCO World H
- Page 121 and 122:
Nature protection oriented legal in
- Page 123 and 124:
for living and favorable conditions
- Page 125 and 126:
During the 2 nd stage that too has
- Page 127 and 128:
The following are the main inter-re
- Page 129 and 130:
Objective II: Ensuring the most eff
- Page 131 and 132:
government compensation, or purchas
- Page 133 and 134:
Output IV.2: Biodiversity database,
- Page 135 and 136:
− Activity V.1.2**/***: Organize
- Page 137 and 138:
Park with a rather vast territory h
- Page 139 and 140:
JMC will develop and maintain its o
- Page 141 and 142:
− uncompromised application of th
- Page 143 and 144:
operation, such as the EU-funded IN
- Page 145 and 146:
Annex 2 to IMP Action plan for the
- Page 147 and 148:
Annex 3 to IMP INTERREG IIIB CADSES
- Page 149 and 150:
pushing the envelope through person
- Page 151 and 152:
IV. Promoting risk management and p
- Page 153 and 154:
Annex 4 to IMP STARTPAGE HUMAN RESO
- Page 155 and 156:
MIMICKING PRIMEVAL FORESTS PATTERNS
- Page 157 and 158:
3.2 Project novelty and expected co
- Page 159 and 160:
groups (ZVO, GOT) have expertise in
- Page 161 and 162:
Two key publications: Commarmot, B.
- Page 163 and 164:
field researchers acquire a better
- Page 165:
ENDPAGE HUMAN RESOURCES AND MOBILIT
- Page 337 and 338: EXPLANATIONS AND CLARIFICATIONS WIT
- Page 339 and 340: the presence of numerous woodpecker
- Page 341 and 342: statements, e. g. informing them on
- Page 343 and 344: ERA ENV in the Slovak Republic - Ge
- Page 345 and 346: CONTENTS Pre-proposal No 1: MICKING
- Page 347 and 348: Pre-proposal No 1 MICKING PRIMEVAL
- Page 349 and 350: Pre-proposal No 1 MICKING PRIMEVAL
- Page 351 and 352: Pre-proposal No 1 MICKING PRIMEVAL
- Page 353 and 354: Pre-proposal No 1 MICKING PRIMEVAL
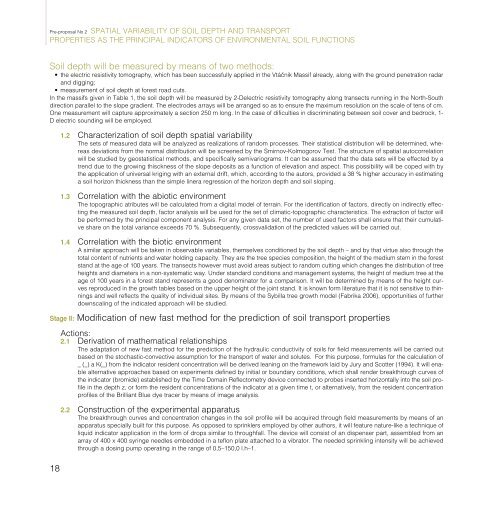
- Page 355 and 356: Pre-proposal No 2 SPATIAL VARIABILI
- Page 357: Pre-proposal No 2 SPATIAL VARIABILI
- Page 362 and 363: NATURE - BASED MANAGEMENT OF BIODIV
- Page 364 and 365: Pre-proposal No 3 NATURE - BASED MA
- Page 366 and 367: Indicator: Differences in growth pe
- Page 368 and 369: Work package 3: Modeling and testin
- Page 370 and 371: Work package 5: Project management
- Page 372 and 373: ENHANCEMENT OF CARBON AND WATER REL
- Page 374 and 375: system management. The data are how
- Page 376 and 377: Pre-proposal No 4 ENHANCEMENT OF CA
- Page 378 and 379: ADAPTATION TO AND MITIGATION OF ADV
- Page 380 and 381: Pre-proposal No 5 ADAPTATION TO AND
- Page 382 and 383: Amphibia and reptilia ; See bottom
- Page 384 and 385: Araneidea - list of species of the
- Page 386 and 387: Leptyphantes pallidus 1 1 Leptyphan
- Page 388 and 389: Xysticus ferrugineus (Menge, 1876)
- Page 390 and 391: Diplocephalus helleri EN Diplocepha
- Page 392 and 393: Philodromus vagulus Phlegra fasciat
- Page 394 and 395: Bird species - 101 species; See bot
- Page 396 and 397: Falco columbarius Linnaeus, 1758 Fa
- Page 398 and 399: Regulus regulus (Linnaeus, 1758) H
- Page 400 and 401: Coleoptera Druh/Species HA VI ST RO
- Page 402 and 403: Carabus coriaceus + + + + Carabus a
- Page 404 and 405: Nebria transsylvanica + + Notiophil
- Page 406 and 407: Triplax russica + + + + Xyleborus d
- Page 408 and 409:
Boletus luridus 1 Boletus pinophilu
- Page 410 and 411:
Dacrymyces nigricans 1 Dacrymyces s
- Page 412 and 413:
Hymenochaete cruenta 1 Hymenochaete
- Page 414 and 415:
Lycogala epidendrum 1 1 Lycoperdon
- Page 416 and 417:
Phaeolepiota aurea 1 Phaeolepiota l
- Page 418 and 419:
Puccinia poarum 1 Pycnoporellus ful
- Page 420 and 421:
Trichia affinis de Bary 1 Tricholom
- Page 422 and 423:
53. Caloplaca flavovirescens 1 54.
- Page 424 and 425:
163. Hypogymnia vittata 1 1 1 164.
- Page 426 and 427:
273. Parmelia laevigata 1 1 1 274.
- Page 428 and 429:
383. Ropalospora lugubris 1 384. Sa
- Page 430 and 431:
Tab. 3. List of mammals - 73 specie
- Page 432 and 433:
Conservation HA VI ST RO Status, Re
- Page 434 and 435:
List of Mollusca Druh/Species ST KZ
- Page 436 and 437:
Zebrina detrita Zonitoides nitidus
- Page 438 and 439:
List of mosses SU KZ SV CH MA UH HA
- Page 440 and 441:
69. Bryum weigelii 1 LR: nt 70. Bux
- Page 442 and 443:
128. Dicranum flagellare 129. Dicra
- Page 444 and 445:
176. Frullania fragilifolia 177. Fr
- Page 446 and 447:
224. Jamesoniella autumnalis 225. J
- Page 448 and 449:
272. Mylia anomala 273. Mylia taylo
- Page 450 and 451:
320. Plagiothecium nemorale 1 321.
- Page 452 and 453:
368. Rhizomnium punctatum 1 1 1 1 1
- Page 454 and 455:
416. Sphagnum subsecundum 417. Spha
- Page 456 and 457:
LR:nt - low risk, near threatened L
- Page 458 and 459:
Nematoda Druh/Species HA VI ST RO K
- Page 460 and 461:
Tab. 7: Species list of Lepidoptera
- Page 462 and 463:
Erynnis tages 1 1 1 1 1 Eudia pavon
- Page 464 and 465:
Ponthia daplidice 1 1 1 1 1 Protode
- Page 466 and 467:
Vascular plants - list of species o
- Page 468 and 469:
Althaea officinalis Althaea pallida
- Page 470 and 471:
Bartsia alpina 1 Bassia scoparia Be
- Page 472 and 473:
Carex acutiformis Carex alba 1 Care
- Page 474 and 475:
Cerasus vulgaris Ceratocephala orth
- Page 476 and 477:
Cystopteris regia Dactylis glomerat
- Page 478 and 479:
Eragrostis pilosa Eremogone micrade
- Page 480 and 481:
Galium uliginosum Galium vernum Gal
- Page 482 and 483:
Homogyne alpina 1 1 1 Hordelymus eu
- Page 484 and 485:
Lactuca muralis Lactuca perennis La
- Page 486 and 487:
Luzula pallidula Luzula pilosa 1 1
- Page 488 and 489:
Myosotis pratensis Myosotis radican
- Page 490 and 491:
Phleum pratense 1 1 Phleum rhaeticu
- Page 492 and 493:
Potentilla arenaria ssp. tommasinia
- Page 494 and 495:
Rhinantus minor Rhodax rupifragus R
- Page 496 and 497:
Scabiosa ochroleuca Scilla bifolia
- Page 498 and 499:
Solanum dulcamara 1 Solanum nigrum
- Page 500 and 501:
Tilia cordata Tilia platyphyllos 1
- Page 502 and 503:
Veronica montana 1 1 1 Veronica off
- Page 504 and 505:
Nomination of the “Ancient Beech
- Page 506 and 507:
4 NOMINATION DOSSIER "ANCIENT BEECH
- Page 508 and 509:
6 NOMINATION DOSSIER "ANCIENT BEECH
- Page 510 and 511:
8 NOMINATION DOSSIER "ANCIENT BEECH
- Page 512 and 513:
10 NOMINATION DOSSIER "ANCIENT BEEC
- Page 514 and 515:
12 NOMINATION DOSSIER "ANCIENT BEEC
- Page 516 and 517:
14 NOMINATION DOSSIER "ANCIENT BEEC
- Page 518 and 519:
16 NOMINATION DOSSIER "ANCIENT BEEC
- Page 520 and 521:
18 NOMINATION DOSSIER "ANCIENT BEEC
- Page 522 and 523:
20 NOMINATION DOSSIER "ANCIENT BEEC
- Page 524 and 525:
22 NOMINATION DOSSIER "ANCIENT BEEC
- Page 526 and 527:
24 NOMINATION DOSSIER "ANCIENT BEEC
- Page 528 and 529:
26 NOMINATION DOSSIER "ANCIENT BEEC
- Page 530 and 531:
28 NOMINATION DOSSIER "ANCIENT BEEC
- Page 532 and 533:
30 NOMINATION DOSSIER "ANCIENT BEEC
- Page 534 and 535:
32 NOMINATION DOSSIER "ANCIENT BEEC
- Page 536 and 537:
34 NOMINATION DOSSIER "ANCIENT BEEC
- Page 538 and 539:
36 NOMINATION DOSSIER "ANCIENT BEEC
- Page 540 and 541:
38 NOMINATION DOSSIER "ANCIENT BEEC
- Page 542 and 543:
40 NOMINATION DOSSIER "ANCIENT BEEC
- Page 544 and 545:
42 NOMINATION DOSSIER "ANCIENT BEEC
- Page 546 and 547:
44 NOMINATION DOSSIER "ANCIENT BEEC
- Page 548 and 549:
46 NOMINATION DOSSIER "ANCIENT BEEC
- Page 550 and 551:
48 NOMINATION DOSSIER "ANCIENT BEEC
- Page 552 and 553:
50 NOMINATION DOSSIER "ANCIENT BEEC
- Page 554 and 555:
52 NOMINATION DOSSIER "ANCIENT BEEC
- Page 556 and 557:
54 NOMINATION DOSSIER "ANCIENT BEEC
- Page 558 and 559:
56 NOMINATION DOSSIER "ANCIENT BEEC
- Page 560 and 561:
58 NOMINATION DOSSIER "ANCIENT BEEC
- Page 562 and 563:
60 NOMINATION DOSSIER "ANCIENT BEEC
- Page 564 and 565:
62 NOMINATION DOSSIER "ANCIENT BEEC
- Page 566 and 567:
64 NOMINATION DOSSIER "ANCIENT BEEC
- Page 568 and 569:
66 NOMINATION DOSSIER "ANCIENT BEEC
- Page 570 and 571:
68 NOMINATION DOSSIER "ANCIENT BEEC
- Page 572 and 573:
70 NOMINATION DOSSIER "ANCIENT BEEC
- Page 574 and 575:
72 NOMINATION DOSSIER "ANCIENT BEEC
- Page 576 and 577:
74 NOMINATION DOSSIER "ANCIENT BEEC
- Page 578 and 579:
76 NOMINATION DOSSIER "ANCIENT BEEC
- Page 580 and 581:
78 NOMINATION DOSSIER "ANCIENT BEEC
- Page 582 and 583:
80 NOMINATION DOSSIER "ANCIENT BEEC
- Page 584 and 585:
82 NOMINATION DOSSIER "ANCIENT BEEC
- Page 586 and 587:
84 NOMINATION DOSSIER "ANCIENT BEEC
- Page 588 and 589:
86 NOMINATION DOSSIER "ANCIENT BEEC
- Page 590 and 591:
88 NOMINATION DOSSIER "ANCIENT BEEC
- Page 592 and 593:
90 NOMINATION DOSSIER "ANCIENT BEEC
- Page 594 and 595:
92 NOMINATION DOSSIER "ANCIENT BEEC
- Page 596 and 597:
94 NOMINATION DOSSIER "ANCIENT BEEC
- Page 598 and 599:
96 NOMINATION DOSSIER "ANCIENT BEEC
- Page 600 and 601:
98 NOMINATION DOSSIER "ANCIENT BEEC
- Page 602 and 603:
100 NOMINATION DOSSIER "ANCIENT BEE
- Page 604 and 605:
102 NOMINATION DOSSIER "ANCIENT BEE
- Page 606 and 607:
104 NOMINATION DOSSIER "ANCIENT BEE
- Page 608 and 609:
106 NOMINATION DOSSIER "ANCIENT BEE
- Page 610 and 611:
108 NOMINATION DOSSIER "ANCIENT BEE
- Page 612 and 613:
110 NOMINATION DOSSIER "ANCIENT BEE
- Page 614 and 615:
112 NOMINATION DOSSIER "ANCIENT BEE
- Page 616 and 617:
114 NOMINATION DOSSIER "ANCIENT BEE
- Page 618 and 619:
116 NOMINATION DOSSIER "ANCIENT BEE
- Page 620 and 621:
118 NOMINATION DOSSIER "ANCIENT BEE
- Page 622 and 623:
120 NOMINATION DOSSIER "ANCIENT BEE
- Page 624 and 625:
122 NOMINATION DOSSIER "ANCIENT BEE
- Page 626 and 627:
124 NOMINATION DOSSIER "ANCIENT BEE
- Page 628 and 629:
126 NOMINATION DOSSIER "ANCIENT BEE
- Page 630 and 631:
128 NOMINATION DOSSIER "ANCIENT BEE
- Page 632 and 633:
130 NOMINATION DOSSIER "ANCIENT BEE
- Page 634 and 635:
132 NOMINATION DOSSIER "ANCIENT BEE
- Page 636 and 637:
134 NOMINATION DOSSIER "ANCIENT BEE
- Page 638 and 639:
136 NOMINATION DOSSIER "ANCIENT BEE
- Page 640 and 641:
138 NOMINATION DOSSIER "ANCIENT BEE
- Page 642 and 643:
140 NOMINATION DOSSIER "ANCIENT BEE
- Page 644 and 645:
142 NOMINATION DOSSIER "ANCIENT BEE
- Page 646 and 647:
144 NOMINATION DOSSIER "ANCIENT BEE
- Page 648 and 649:
146 NOMINATION DOSSIER "ANCIENT BEE
- Page 650 and 651:
148 NOMINATION DOSSIER "ANCIENT BEE
- Page 652 and 653:
150 NOMINATION DOSSIER "ANCIENT BEE
- Page 654 and 655:
152 NOMINATION DOSSIER "ANCIENT BEE
- Page 656 and 657:
154 NOMINATION DOSSIER "ANCIENT BEE
- Page 658 and 659:
156 NOMINATION DOSSIER "ANCIENT BEE
- Page 660 and 661:
158 NOMINATION DOSSIER "ANCIENT BEE
- Page 662 and 663:
160 NOMINATION DOSSIER "ANCIENT BEE
- Page 664 and 665:
162 NOMINATION DOSSIER "ANCIENT BEE
- Page 666 and 667:
164 NOMINATION DOSSIER "ANCIENT BEE
- Page 668 and 669:
166 NOMINATION DOSSIER "ANCIENT BEE
- Page 670 and 671:
168 NOMINATION DOSSIER "ANCIENT BEE
- Page 672 and 673:
170 NOMINATION DOSSIER "ANCIENT BEE
- Page 674 and 675:
172 NOMINATION DOSSIER "ANCIENT BEE
- Page 676 and 677:
174 NOMINATION DOSSIER "ANCIENT BEE
- Page 678 and 679:
176 NOMINATION DOSSIER "ANCIENT BEE
- Page 680 and 681:
178 NOMINATION DOSSIER "ANCIENT BEE
- Page 682 and 683:
180 NOMINATION DOSSIER "ANCIENT BEE
- Page 684 and 685:
182 NOMINATION DOSSIER "ANCIENT BEE
- Page 686 and 687:
Annex to Chapter 1 Nationale Naturl
- Page 688 and 689:
1.2 Topographical map of the nomina
- Page 690 and 691:
1.4 Topographical map of the nomina
- Page 692 and 693:
Annex to Chapter 3 Nationale Naturl
- Page 694 and 695:
3.2 Publication Natur & Landschaft
- Page 696 and 697:
5.1 Summary minutes of the trilater
- Page 698 and 699:
NOMINATION DOSSIER ANNEX 5.1 "ANCIE
- Page 700 and 701:
NOMINATION DOSSIER ANNEX 5.1 "ANCIE
- Page 702 and 703:
NOMINATION DOSSIER ANNEX 5.1 "ANCIE
- Page 704 and 705:
NOMINATION DOSSIER ANNEX 5.1 "ANCIE
- Page 706 and 707:
NOMINATION DOSSIER ANNEX 5.1 "ANCIE
- Page 708 and 709:
NOMINATION DOSSIER ANNEX 5.1 "ANCIE
- Page 710 and 711:
NOMINATION DOSSIER ANNEX 5.1 "ANCIE
- Page 712 and 713:
NOMINATION DOSSIER ANNEX 5.1 "ANCIE
- Page 714 and 715:
NOMINATION DOSSIER ANNEX 5.1 "ANCIE
- Page 716 and 717:
NOMINATION DOSSIER ANNEX 5.2 "ANCIE
- Page 718 and 719:
NOMINATION DOSSIER ANNEX 5.2 "ANCIE
- Page 720 and 721:
NOMINATION DOSSIER ANNEX 5.2 "ANCIE
- Page 722 and 723:
NOMINATION DOSSIER ANNEX 5.3 "ANCIE
- Page 724 and 725:
NOMINATION DOSSIER ANNEX 5.4 "ANCIE
- Page 726 and 727:
NOMINATION DOSSIER ANNEX 5.4 "ANCIE
- Page 728 and 729:
NOMINATION DOSSIER ANNEX 5.5 "ANCIE
- Page 730 and 731:
NOMINATION DOSSIER ANNEX 5.5 "ANCIE
- Page 732 and 733:
NOMINATION DOSSIER ANNEX 5.5 "ANCIE
- Page 734 and 735:
5.6 Communication strategy: beech f
- Page 736 and 737:
NOMINATION DOSSIER ANNEX 5.6 "ANCIE
- Page 738 and 739:
NOMINATION DOSSIER ANNEX 5.6 "ANCIE
- Page 740 and 741:
NOMINATION DOSSIER ANNEX 5.6 "ANCIE
- Page 742 and 743:
NOMINATION DOSSIER ANNEX 5.6 "ANCIE
- Page 744 and 745:
NOMINATION DOSSIER ANNEX 5.6 "ANCIE
- Page 746 and 747:
NOMINATION DOSSIER ANNEX 5.6 "ANCIE
- Page 748 and 749:
NOMINATION DOSSIER ANNEX 5.6 "ANCIE
- Page 750 and 751:
NOMINATION DOSSIER ANNEX 5.7 "ANCIE
- Page 752 and 753:
NOMINATION DOSSIER ANNEX 5.7 "ANCIE
- Page 754 and 755:
5.8 List of events to announce the
- Page 756 and 757:
NOMINATION DOSSIER ANNEX 5.8 "ANCIE
- Page 758 and 759:
NOMINATION DOSSIER ANNEX 5.8 "ANCIE
- Page 760 and 761:
NOMINATION DOSSIER ANNEX 5.8 "ANCIE
- Page 762 and 763:
NOMINATION DOSSIER ANNEX 5.9 "ANCIE
- Page 764 and 765:
5.10 Exhibition flyer containing th
- Page 766 and 767:
NOMINATION DOSSIER ANNEX 5.11 "ANCI
- Page 768 and 769:
5.12 Leaflet in German and English
- Page 770 and 771:
Annex to Chapter 6 Nationale Naturl
- Page 772 and 773:
Foreword In May 2008, the city of B
- Page 774 and 775:
5.10.2 Hydropower 106 5.10.3 Wind E
- Page 776 and 777:
15.1.9 Alpine Convention 287 15.1.1
- Page 778 and 779:
6.2.1 Fundamentals for a modern man
- Page 780 and 781:
6.2.2 Summary of the current applic
- Page 782 and 783:
NOMINATION DOSSIER ANNEX 6.2.2 "ANC
- Page 784 and 785:
7.1 Digital photographic documentat
- Page 786 and 787:
NOMINATION DOSSIER ANNEX 7.1 „ANC
- Page 788 and 789:
NOMINATION DOSSIER ANNEX 7.1 „ANC
- Page 790 and 791:
7.2.1 Decree on the designation of
- Page 792 and 793:
NOMINATION DOSSIER ANNEX 7.2.1 "ANC
- Page 794 and 795:
NOMINATION DOSSIER ANNEX 7.2.1 "ANC
- Page 796 and 797:
NOMINATION DOSSIER ANNEX 7.2.1 "ANC
- Page 798 and 799:
NOMINATION DOSSIER ANNEX 7.2.1 "ANC
- Page 800 and 801:
7.2.2 Decree on the designation of
- Page 802 and 803:
NOMINATION DOSSIER ANNEX 7.2.2 "ANC
- Page 804 and 805:
NOMINATION DOSSIER ANNEX 7.2.2 "ANC
- Page 806 and 807:
NOMINATION DOSSIER ANNEX 7.2.2 "ANC
- Page 808 and 809:
NOMINATION DOSSIER ANNEX 7.2.2 "ANC
- Page 810 and 811:
NOMINATION DOSSIER ANNEX 7.2.2 "ANC
- Page 812 and 813:
NOMINATION DOSSIER ANNEX 7.2.2 "ANC
- Page 814 and 815:
NOMINATION DOSSIER ANNEX 7.2.2 "ANC
- Page 816 and 817:
NOMINATION DOSSIER ANNEX 7.2.2 "ANC
- Page 818 and 819:
7.2.3 Decree on the regulation of h
- Page 820 and 821:
NOMINATION DOSSIER ANNEX 7.2.3 "ANC
- Page 822 and 823:
NOMINATION DOSSIER ANNEX 7.2.3 "ANC
- Page 824 and 825:
7.2.4 Ordinance regulating the desi
- Page 826 and 827:
NOMINATION DOSSIER ANNEX 7.2.4 "ANC
- Page 828 and 829:
NOMINATION DOSSIER ANNEX 7.2.4 "ANC
- Page 830 and 831:
NOMINATION DOSSIER ANNEX 7.2.4 "ANC
- Page 832 and 833:
NOMINATION DOSSIER ANNEX 7.2.4 "ANC
- Page 834 and 835:
NOMINATION DOSSIER ANNEX 7.2.4 "ANC
- Page 836 and 837:
NOMINATION DOSSIER ANNEX 7.2.4 "ANC
- Page 838 and 839:
NOMINATION DOSSIER ANNEX 7.2.5 "ANC
- Page 840 and 841:
NOMINATION DOSSIER ANNEX 7.2.5 "ANC
- Page 842 and 843:
NOMINATION DOSSIER ANNEX 7.2.5 "ANC
- Page 844 and 845:
NOMINATION DOSSIER ANNEX 7.2.5 "ANC
- Page 846 and 847:
NOMINATION DOSSIER ANNEX 7.2.5 "ANC
- Page 848 and 849:
7.2.6 Thuringian Order amending the
- Page 850 and 851:
7.2.7 Ordinance of the Kellerwald-E
- Page 852 and 853:
NOMINATION DOSSIER ANNEX 7.2.7 "ANC
- Page 854 and 855:
NOMINATION DOSSIER ANNEX 7.2.7 "ANC
- Page 856 and 857:
NOMINATION DOSSIER ANNEX 7.2.7 "ANC
- Page 858 and 859:
NOMINATION DOSSIER ANNEX 7.2.7 "ANC
- Page 860 and 861:
NOMINATION DOSSIER ANNEX 7.2.7 "ANC
- Page 862 and 863:
NOMINATION DOSSIER ANNEX 7.2.7 "ANC
- Page 864 and 865:
NOMINATION DOSSIER ANNEX 7.2.7 "ANC
- Page 866 and 867:
NOMINATION DOSSIER ANNEX 7.2.7 "ANC
- Page 868 and 869:
7.3.1 Integrated Management System
- Page 870 and 871:
NOMINATION DOSSIER ANNEX 7.3.1 "ANC
- Page 872 and 873:
NOMINATION DOSSIER ANNEX 7.3.1 "ANC
- Page 874 and 875:
NOMINATION DOSSIER ANNEX 7.3.1 "ANC
- Page 876 and 877:
NOMINATION DOSSIER ANNEX 7.3.1 "ANC
- Page 878 and 879:
NOMINATION DOSSIER ANNEX 7.3.1 "ANC
- Page 880 and 881:
NOMINATION DOSSIER ANNEX 7.3.1 "ANC
- Page 882 and 883:
NOMINATION DOSSIER ANNEX 7.3.1 "ANC
- Page 884 and 885:
NOMINATION DOSSIER ANNEX 7.3.1 "ANC
- Page 886 and 887:
NOMINATION DOSSIER ANNEX 7.3.1 "ANC
- Page 888 and 889:
NOMINATION DOSSIER ANNEX 7.3.1 "ANC
- Page 890 and 891:
NOMINATION DOSSIER ANNEX 7.3.1 "ANC
- Page 892 and 893:
NOMINATION DOSSIER ANNEX 7.3.1 "ANC
- Page 894 and 895:
NOMINATION DOSSIER ANNEX 7.3.1 "ANC
- Page 896 and 897:
NOMINATION DOSSIER ANNEX 7.3.1 "ANC
- Page 898 and 899:
7.3.2 Coordinated management for th
- Page 900 and 901:
NOMINATION DOSSIER ANNEX 7.3.2 "ANC
- Page 902 and 903:
NOMINATION DOSSIER ANNEX 7.3.2 "ANC
- Page 904 and 905:
NOMINATION DOSSIER ANNEX 7.3.2 "ANC
- Page 906 and 907:
NOMINATION DOSSIER ANNEX 7.3.2 "ANC
- Page 908 and 909:
NOMINATION DOSSIER ANNEX 7.3.2 "ANC
- Page 910 and 911:
NOMINATION DOSSIER ANNEX 7.3.2 "ANC
- Page 912 and 913:
NOMINATION DOSSIER ANNEX 7.3.2 "ANC
- Page 914 and 915:
NOMINATION DOSSIER ANNEX 7.3.2 "ANC
- Page 916 and 917:
NOMINATION DOSSIER ANNEX 7.3.2 "ANC
- Page 918 and 919:
NOMINATION DOSSIER ANNEX 7.3.2 "ANC
- Page 920 and 921:
NOMINATION DOSSIER ANNEX 7.3.3 "ANC
- Page 922 and 923:
NOMINATION DOSSIER ANNEX 7.3.3 "ANC
- Page 924 and 925:
NOMINATION DOSSIER ANNEX 7.3.3 "ANC
- Page 926 and 927:
7.3.4 National Park Plan for the M
- Page 928 and 929:
NOMINATION DOSSIER ANNEX 7.3.4 "ANC
- Page 930 and 931:
NOMINATION DOSSIER ANNEX 7.3.5 "ANC
- Page 932 and 933:
NOMINATION DOSSIER ANNEX 7.3.5 "ANC
- Page 934 and 935:
7.3.6 National Park Plan for the Ha
- Page 936 and 937:
NOMINATION DOSSIER ANNEX 7.3.6 "ANC
- Page 938 and 939:
NATIONAL PARK PLAN FOR THE KELLERWA
- Page 940 and 941:
Preface NATIONAL PARK PLAN 2008 Nat
- Page 942 and 943:
L NATIONAL PARK PLAN 2008 - APPROAC
- Page 944 and 945:
13/15, ave. Franklin D. Roosevelt -