The Use of Iambic Pentameter in the
The Use of Iambic Pentameter in the
The Use of Iambic Pentameter in the

Create successful ePaper yourself
Turn your PDF publications into a flip-book with our unique Google optimized e-Paper software.
Frequency<br />
120<br />
100<br />
80<br />
60<br />
40<br />
20<br />
Global Group<strong>in</strong>g<br />
0<br />
0 200 400 600 800 1000 1200<br />
A<br />
RT (ms)<br />
120<br />
100<br />
80<br />
60<br />
40<br />
20<br />
Local Group<strong>in</strong>g<br />
0<br />
0 200 400 600 800 1000 1200<br />
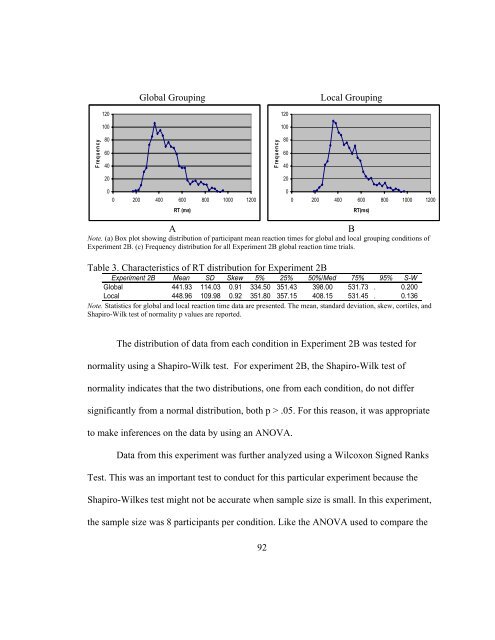
Note. (a) Box plot show<strong>in</strong>g distribution <strong>of</strong> participant mean reaction times for global and local group<strong>in</strong>g conditions <strong>of</strong><br />
Experiment 2B. (c) Frequency distribution for all Experiment 2B global reaction time trials.<br />
Table 3. Characteristics <strong>of</strong> RT distribution for Experiment 2B<br />
Experiment 2B Mean SD Skew 5% 25% 50%/Med 75% 95% S-W<br />
Global 441.93 114.03 0.91 334.50 351.43 398.00 531.73 . 0.200<br />
Local 448.96 109.98 0.92 351.80 357.15 408.15 531.45 . 0.136<br />
Note. Statistics for global and local reaction time data are presented. <strong>The</strong> mean, standard deviation, skew, cortiles, and<br />
Shapiro-Wilk test <strong>of</strong> normality p values are reported.<br />
Frequency<br />
B<br />
RT(ms)<br />
<strong>The</strong> distribution <strong>of</strong> data from each condition <strong>in</strong> Experiment 2B was tested for<br />
normality us<strong>in</strong>g a Shapiro-Wilk test. For experiment 2B, <strong>the</strong> Shapiro-Wilk test <strong>of</strong><br />
normality <strong>in</strong>dicates that <strong>the</strong> two distributions, one from each condition, do not differ<br />
significantly from a normal distribution, both p > .05. For this reason, it was appropriate<br />
to make <strong>in</strong>ferences on <strong>the</strong> data by us<strong>in</strong>g an ANOVA.<br />
Data from this experiment was fur<strong>the</strong>r analyzed us<strong>in</strong>g a Wilcoxon Signed Ranks<br />
Test. This was an important test to conduct for this particular experiment because <strong>the</strong><br />
Shapiro-Wilkes test might not be accurate when sample size is small. In this experiment,<br />
<strong>the</strong> sample size was 8 participants per condition. Like <strong>the</strong> ANOVA used to compare <strong>the</strong><br />
92