The Use of Iambic Pentameter in the
The Use of Iambic Pentameter in the
The Use of Iambic Pentameter in the

You also want an ePaper? Increase the reach of your titles
YUMPU automatically turns print PDFs into web optimized ePapers that Google loves.
50ms, Experimental, Global Group<strong>in</strong>g<br />
Frequency<br />
300<br />
250<br />
200<br />
150<br />
100<br />
50<br />
0<br />
0 200 400 600 800 1000 1200 1400<br />
RT (ms)<br />
B<br />
4000ms, Experimental, Global Group<strong>in</strong>g<br />
Frequency<br />
300<br />
250<br />
200<br />
150<br />
100<br />
50<br />
0<br />
0 200 400 600 800 1000 1200 1400<br />
D<br />
RT (ms)<br />
Frequency<br />
50ms, Experimental, Local Group<strong>in</strong>g<br />
300<br />
250<br />
200<br />
150<br />
100<br />
50<br />
0<br />
0 200 400 600 800 1000 1200 1400<br />
RT (ms)<br />
4000ms, Experimental, Local Group<strong>in</strong>g<br />
300<br />
250<br />
200<br />
150<br />
100<br />
50<br />
C<br />
0<br />
0 200 400 600 800 1000 1200 1400<br />
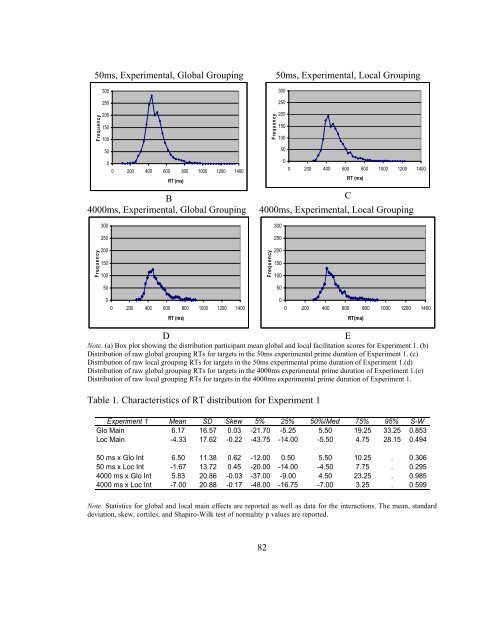
Note. (a) Box plot show<strong>in</strong>g <strong>the</strong> distribution participant mean global and local facilitation scores for Experiment 1. (b)<br />
Distribution <strong>of</strong> raw global group<strong>in</strong>g RTs for targets <strong>in</strong> <strong>the</strong> 50ms experimental prime duration <strong>of</strong> Experiment 1. (c)<br />
Distribution <strong>of</strong> raw local group<strong>in</strong>g RTs for targets <strong>in</strong> <strong>the</strong> 50ms experimental prime duration <strong>of</strong> Experiment 1.(d)<br />
Distribution <strong>of</strong> raw global group<strong>in</strong>g RTs for targets <strong>in</strong> <strong>the</strong> 4000ms experimental prime duration <strong>of</strong> Experiment 1.(e)<br />
Distribution <strong>of</strong> raw local group<strong>in</strong>g RTs for targets <strong>in</strong> <strong>the</strong> 4000ms experimental prime duration <strong>of</strong> Experiment 1.<br />
Table 1. Characteristics <strong>of</strong> RT distribution for Experiment 1<br />
Experiment 1 Mean SD Skew 5% 25% 50%/Med 75% 95% S-W<br />
Glo Ma<strong>in</strong> 6.17 16.57 0.03 -21.70 -5.25 5.50 19.25 33.25 0.853<br />
Loc Ma<strong>in</strong> -4.33 17.62 -0.22 -43.75 -14.00 -5.50 4.75 28.15 0.494<br />
50 ms x Glo Int 6.50 11.38 0.62 -12.00 0.50 5.50 10.25 . 0.306<br />
50 ms x Loc Int -1.67 13.72 0.45 -20.00 -14.00 -4.50 7.75 . 0.295<br />
4000 ms x Glo Int 5.83 20.86 -0.03 -37.00 -9.00 4.50 23.25 . 0.985<br />
4000 ms x Loc Int -7.00 20.88 -0.17 -48.00 -16.75 -7.00 3.25 . 0.599<br />
Note. Statistics for global and local ma<strong>in</strong> effects are reported as well as data for <strong>the</strong> <strong>in</strong>teractions. <strong>The</strong> mean, standard<br />
deviation, skew, cortiles, and Shapiro-Wilk test <strong>of</strong> normality p values are reported.<br />
Frequency<br />
82<br />
RT(ms)<br />
E