The Use of Iambic Pentameter in the
The Use of Iambic Pentameter in the
The Use of Iambic Pentameter in the

Create successful ePaper yourself
Turn your PDF publications into a flip-book with our unique Google optimized e-Paper software.
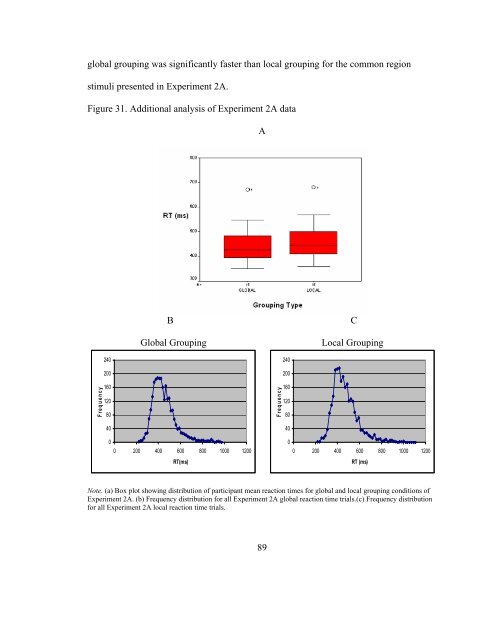
global group<strong>in</strong>g was significantly faster than local group<strong>in</strong>g for <strong>the</strong> common region<br />
stimuli presented <strong>in</strong> Experiment 2A.<br />
Figure 31. Additional analysis <strong>of</strong> Experiment 2A data<br />
Frequency<br />
240<br />
200<br />
160<br />
120<br />
80<br />
40<br />
A<br />
B C<br />
Global Group<strong>in</strong>g<br />
0<br />
0 200 400 600 800 1000 1200<br />
RT(ms)<br />
240<br />
200<br />
160<br />
120<br />
80<br />
40<br />
Local Group<strong>in</strong>g<br />
0<br />
0 200 400 600 800 1000 1200<br />
Note. (a) Box plot show<strong>in</strong>g distribution <strong>of</strong> participant mean reaction times for global and local group<strong>in</strong>g conditions <strong>of</strong><br />
Experiment 2A. (b) Frequency distribution for all Experiment 2A global reaction time trials.(c) Frequency distribution<br />
for all Experiment 2A local reaction time trials.<br />
89<br />
Frequency<br />
RT (ms)