The Use of Iambic Pentameter in the
The Use of Iambic Pentameter in the
The Use of Iambic Pentameter in the

You also want an ePaper? Increase the reach of your titles
YUMPU automatically turns print PDFs into web optimized ePapers that Google loves.
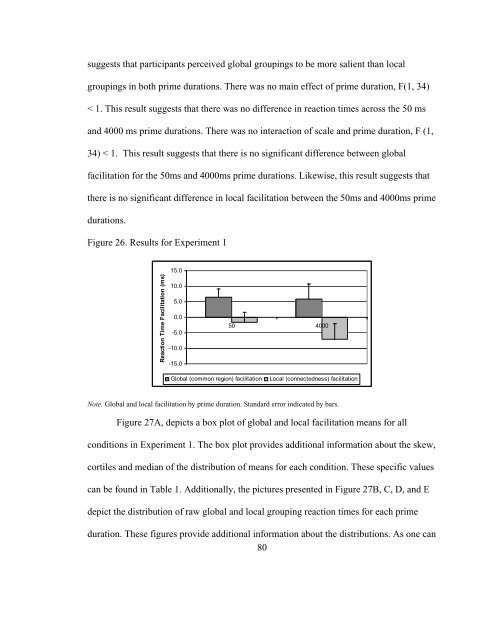
suggests that participants perceived global group<strong>in</strong>gs to be more salient than local<br />
group<strong>in</strong>gs <strong>in</strong> both prime durations. <strong>The</strong>re was no ma<strong>in</strong> effect <strong>of</strong> prime duration, F(1, 34)<br />
< 1. This result suggests that <strong>the</strong>re was no difference <strong>in</strong> reaction times across <strong>the</strong> 50 ms<br />
and 4000 ms prime durations. <strong>The</strong>re was no <strong>in</strong>teraction <strong>of</strong> scale and prime duration, F (1,<br />
34) < 1. This result suggests that <strong>the</strong>re is no significant difference between global<br />
facilitation for <strong>the</strong> 50ms and 4000ms prime durations. Likewise, this result suggests that<br />
<strong>the</strong>re is no significant difference <strong>in</strong> local facilitation between <strong>the</strong> 50ms and 4000ms prime<br />
durations.<br />
Figure 26. Results for Experiment 1<br />
Reaction Time Facilitation (ms)<br />
15.0<br />
10.0<br />
5.0<br />
0.0<br />
-5.0<br />
-10.0<br />
-15.0<br />
50 4000<br />
Global (common region) facilitation Local (connectedness) facilitation<br />
Note. Global and local facilitation by prime duration. Standard error <strong>in</strong>dicated by bars.<br />
Figure 27A, depicts a box plot <strong>of</strong> global and local facilitation means for all<br />
conditions <strong>in</strong> Experiment 1. <strong>The</strong> box plot provides additional <strong>in</strong>formation about <strong>the</strong> skew,<br />
cortiles and median <strong>of</strong> <strong>the</strong> distribution <strong>of</strong> means for each condition. <strong>The</strong>se specific values<br />
can be found <strong>in</strong> Table 1. Additionally, <strong>the</strong> pictures presented <strong>in</strong> Figure 27B, C, D, and E<br />
depict <strong>the</strong> distribution <strong>of</strong> raw global and local group<strong>in</strong>g reaction times for each prime<br />
duration. <strong>The</strong>se figures provide additional <strong>in</strong>formation about <strong>the</strong> distributions. As one can<br />
80