

a la physique de l'information - Lisa - Université d'Angers
a la physique de l'information - Lisa - Université d'Angers
a la physique de l'information - Lisa - Université d'Angers

Create successful ePaper yourself
Turn your PDF publications into a flip-book with our unique Google optimized e-Paper software.
1290 J. Opt. Soc. Am. A/Vol. 25, No. 6/June 2008 Chapeau-Blon<strong>de</strong>au et al.<br />
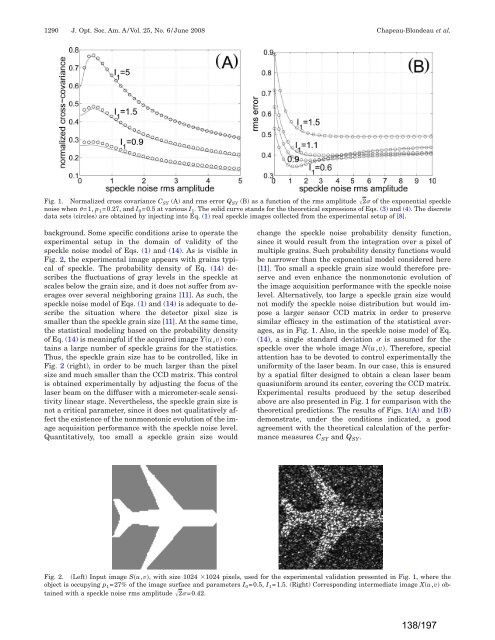
Fig. 1. Normalized cross covariance C SY (A) and rms error Q SY (B) as a function of the rms amplitu<strong>de</strong> 2 of the exponential speckle<br />
noise when =1, p 1=0.27, and I 0=0.5 at various I 1. The solid curve stands for the theoretical expressions of Eqs. (3) and (4). The discrete<br />
data sets (circles) are obtained by injecting into Eq. (1) real speckle images collected from the experimental setup of [8].<br />
background. Some specific conditions arise to operate the<br />
experimental setup in the domain of validity of the<br />
speckle noise mo<strong>de</strong>l of Eqs. (1) and (14). As is visible in<br />
Fig. 2, the experimental image appears with grains typical<br />
of speckle. The probability <strong>de</strong>nsity of Eq. (14) <strong>de</strong>scribes<br />
the fluctuations of gray levels in the speckle at<br />
scales below the grain size, and it does not suffer from averages<br />
over several neighboring grains [11]. As such, the<br />
speckle noise mo<strong>de</strong>l of Eqs. (1) and (14) is a<strong>de</strong>quate to <strong>de</strong>scribe<br />
the situation where the <strong>de</strong>tector pixel size is<br />
smaller than the speckle grain size [11]. At the same time,<br />
the statistical mo<strong>de</strong>ling based on the probability <strong>de</strong>nsity<br />
of Eq. (14) is meaningful if the acquired image Yu,v contains<br />
a <strong>la</strong>rge number of speckle grains for the statistics.<br />
Thus, the speckle grain size has to be controlled, like in<br />
Fig. 2 (right), in or<strong>de</strong>r to be much <strong>la</strong>rger than the pixel<br />
size and much smaller than the CCD matrix. This control<br />
is obtained experimentally by adjusting the focus of the<br />
<strong>la</strong>ser beam on the diffuser with a micrometer-scale sensitivity<br />
linear stage. Nevertheless, the speckle grain size is<br />
not a critical parameter, since it does not qualitatively affect<br />
the existence of the nonmonotonic evolution of the image<br />
acquisition performance with the speckle noise level.<br />
Quantitatively, too small a speckle grain size would<br />
change the speckle noise probability <strong>de</strong>nsity function,<br />
since it would result from the integration over a pixel of<br />
multiple grains. Such probability <strong>de</strong>nsity functions would<br />
be narrower than the exponential mo<strong>de</strong>l consi<strong>de</strong>red here<br />
[11]. Too small a speckle grain size would therefore preserve<br />
and even enhance the nonmonotonic evolution of<br />
the image acquisition performance with the speckle noise<br />
level. Alternatively, too <strong>la</strong>rge a speckle grain size would<br />
not modify the speckle noise distribution but would impose<br />
a <strong>la</strong>rger sensor CCD matrix in or<strong>de</strong>r to preserve<br />
simi<strong>la</strong>r efficacy in the estimation of the statistical averages,<br />
as in Fig. 1. Also, in the speckle noise mo<strong>de</strong>l of Eq.<br />
(14), a single standard <strong>de</strong>viation is assumed for the<br />
speckle over the whole image Nu,v. Therefore, special<br />
attention has to be <strong>de</strong>voted to control experimentally the<br />
uniformity of the <strong>la</strong>ser beam. In our case, this is ensured<br />
by a spatial filter <strong>de</strong>signed to obtain a clean <strong>la</strong>ser beam<br />
quasiuniform around its center, covering the CCD matrix.<br />
Experimental results produced by the setup <strong>de</strong>scribed<br />
above are also presented in Fig. 1 for comparison with the<br />
theoretical predictions. The results of Figs. 1(A) and 1(B)<br />
<strong>de</strong>monstrate, un<strong>de</strong>r the conditions indicated, a good<br />
agreement with the theoretical calcu<strong>la</strong>tion of the performance<br />
measures C SY and Q SY.<br />
Fig. 2. (Left) Input image Su,v, with size 1024 1024 pixels, used for the experimental validation presented in Fig. 1, where the<br />
object is occupying p 1=27% of the image surface and parameters I 0=0.5, I 1=1.5. (Right) Corresponding intermediate image Xu,v obtained<br />
with a speckle noise rms amplitu<strong>de</strong> 2=0.42.<br />
138/197