

a la physique de l'information - Lisa - Université d'Angers
a la physique de l'information - Lisa - Université d'Angers
a la physique de l'information - Lisa - Université d'Angers

Create successful ePaper yourself
Turn your PDF publications into a flip-book with our unique Google optimized e-Paper software.
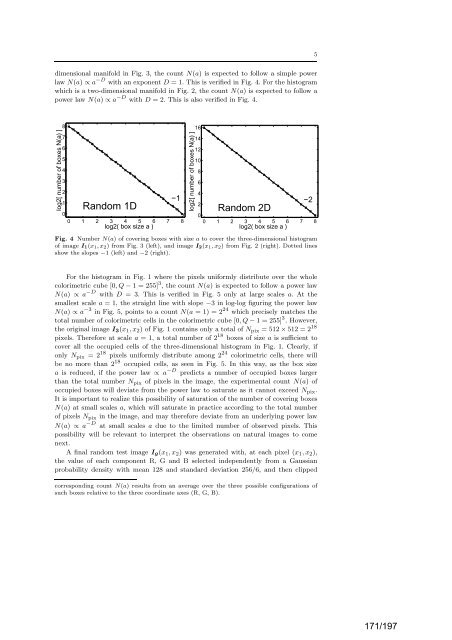
dimensional manifold in Fig. 3, the count N(a) is expected to follow a simple power<br />
<strong>la</strong>w N(a) ∝ a −D with an exponent D = 1. This is verified in Fig. 4. For the histogram<br />
which is a two-dimensional manifold in Fig. 2, the count N(a) is expected to follow a<br />
power <strong>la</strong>w N(a) ∝ a −D with D = 2. This is also verified in Fig. 4.<br />
log2[ number of boxes N(a) ]<br />
8<br />
7<br />
6<br />
5<br />
4<br />
3<br />
2<br />
1<br />
Random 1D<br />
−1<br />
0<br />
0 1 2 3 4 5 6<br />
log2( box size a )<br />
7 8<br />
log2[ number of boxes N(a) ]<br />
16<br />
14<br />
12<br />
10<br />
8<br />
6<br />
4<br />
2<br />
Random 2D<br />
−2<br />
0<br />
0 1 2 3 4 5 6<br />
log2( box size a )<br />
7 8<br />
Fig. 4 Number N(a) of covering boxes with size a to cover the three-dimensional histogram<br />
of image I1(x1, x2) from Fig. 3 (left), and image I2(x1, x2) from Fig. 2 (right). Dotted lines<br />
show the slopes −1 (left) and −2 (right).<br />
For the histogram in Fig. 1 where the pixels uniformly distribute over the whole<br />
colorimetric cube [0, Q − 1 = 255] 3 , the count N(a) is expected to follow a power <strong>la</strong>w<br />
N(a) ∝ a −D with D = 3. This is verified in Fig. 5 only at <strong>la</strong>rge scales a. At the<br />
smallest scale a = 1, the straight line with slope −3 in log-log figuring the power <strong>la</strong>w<br />
N(a) ∝ a −3 in Fig. 5, points to a count N(a = 1) = 2 24 which precisely matches the<br />
total number of colorimetric cells in the colorimetric cube [0, Q − 1 = 255] 3 . However,<br />
the original image I3(x1, x2) of Fig. 1 contains only a total of Npix = 512 × 512 = 2 18<br />
pixels. Therefore at scale a = 1, a total number of 2 18 boxes of size a is sufficient to<br />
cover all the occupied cells of the three-dimensional histogram in Fig. 1. Clearly, if<br />
only Npix = 2 18 pixels uniformly distribute among 2 24 colorimetric cells, there will<br />
be no more than 2 18 occupied cells, as seen in Fig. 5. In this way, as the box size<br />
a is reduced, if the power <strong>la</strong>w ∝ a −D predicts a number of occupied boxes <strong>la</strong>rger<br />
than the total number Npix of pixels in the image, the experimental count N(a) of<br />
occupied boxes will <strong>de</strong>viate from the power <strong>la</strong>w to saturate as it cannot exceed Npix.<br />
It is important to realize this possibility of saturation of the number of covering boxes<br />
N(a) at small scales a, which will saturate in practice according to the total number<br />
of pixels Npix in the image, and may therefore <strong>de</strong>viate from an un<strong>de</strong>rlying power <strong>la</strong>w<br />
N(a) ∝ a −D at small scales a due to the limited number of observed pixels. This<br />
possibility will be relevant to interpret the observations on natural images to come<br />
next.<br />
A final random test image Ig(x1, x2) was generated with, at each pixel (x1, x2),<br />
the value of each component R, G and B selected in<strong>de</strong>pen<strong>de</strong>ntly from a Gaussian<br />
probability <strong>de</strong>nsity with mean 128 and standard <strong>de</strong>viation 256/6, and then clipped<br />
corresponding count N(a) results from an average over the three possible configurations of<br />
such boxes re<strong>la</strong>tive to the three coordinate axes (R, G, B).<br />
5<br />
171/197