- Page 1 and 2:
October 2, 2012 To: Dr. Steve Kinse
- Page 3 and 4:
II.B.1. one-stop center. The remode
- Page 5 and 6:
Table of Contents Message from the
- Page 7 and 8:
Strategic Planning Process and Impl
- Page 9 and 10: Strategic Planning Work Group Membe
- Page 11 and 12: College Strategic Goals, Objectives
- Page 13 and 14: This objective aligns with KCCD Str
- Page 15 and 16: This objective aligns with Actionab
- Page 17 and 18: Appendix A Bakersfield College Stra
- Page 19 and 20: Bakersfield College Strategic Goals
- Page 21 and 22: KCCD Strategic Plan K Summer-Fall 2
- Page 23 and 24: 5 Evaluation Spring Appendix D Bake
- Page 25 and 26: Strategic Plan Elements Appendix F
- Page 27 and 28: • Develop, implement, and evaluat
- Page 29 and 30: Internal Scan A look at the distric
- Page 31: Resource Allocation The determinati
- Page 34 and 35: Opportunities for the Future ......
- Page 36 and 37: The Context for the 2011-2014 Educa
- Page 38 and 39: higher education choice. In respons
- Page 40 and 41: Values, Vision, Mission, and Goals
- Page 42 and 43: 2010. Viewed in this light, it will
- Page 44 and 45: U.S. Economic Indicators Sources: B
- Page 46 and 47: forecast to continue through 2011 a
- Page 48 and 49: is also supported by the tourism an
- Page 50 and 51: Industry Types and Diversification
- Page 52 and 53: Current Comparison of Key Economic
- Page 54 and 55: The community colleges may be helpe
- Page 56 and 57: 1. Increase college and career read
- Page 58 and 59: The California Department of Financ
- Page 62 and 63: indicated they were Some Other Race
- Page 64 and 65: Statewide Community College Partici
- Page 66 and 67: Participation in the California com
- Page 68 and 69: College Going Age Group Growth in E
- Page 70 and 71: Primary Source High Schools Headcou
- Page 72 and 73: • The projected population, incom
- Page 74 and 75: Residents of Hispanic descent, rega
- Page 76 and 77: 2010 Educational Attainment, Age 25
- Page 78 and 79: Incoming Students: Educational Goal
- Page 80 and 81: Enrolled Students: Minority Enrollm
- Page 82 and 83: Student Completion: Awards and Tran
- Page 84 and 85: Employees An on-going challenge at
- Page 86 and 87: Counseling Services and Enrollment
- Page 88 and 89: Institutional Effectiveness Assessm
- Page 90 and 91: Student Persistence Rates Fall Term
- Page 92 and 93: Number of Transfers Transfer Studen
- Page 94 and 95: Annual FTES (Full-Time Equivalent S
- Page 96 and 97: 75/25 (Full-Time/Part-Time Faculty)
- Page 98 and 99: Program Reviews: Instructional Prog
- Page 100 and 101: • Employers report minimal intera
- Page 102 and 103: in Teaching,” and the AAHE “9 P
- Page 104 and 105: Strategic Priorities Strategic Plan
- Page 106 and 107: Bakersfield CollegeStrategic Goals
- Page 108 and 109: Opportunities for the Future Future
- Page 110 and 111:
Where the California Jobs Will Be I
- Page 112 and 113:
Medical Imaging Occupations in the
- Page 114 and 115:
agricultural managers and accountan
- Page 116 and 117:
Kern County Fastest Growing Occupat
- Page 118 and 119:
The enactment of the Student Transf
- Page 120 and 121:
Kern County Occupations Commonly Re
- Page 122 and 123:
are providing one or more online co
- Page 124 and 125:
Bakersfield College Strong Programs
- Page 126 and 127:
Programs that Might be Reconsidered
- Page 128 and 129:
With these recent research papers,
- Page 130 and 131:
Bakersfield College - Main Campus F
- Page 132 and 133:
Bakersfield College - Main Campus W
- Page 134 and 135:
The rate of growth in headcount for
- Page 136 and 137:
Bakersfield College - Delano Center
- Page 138 and 139:
The rate of growth in headcount for
- Page 140 and 141:
Determination of Future Space Needs
- Page 142 and 143:
Bakersfield College - Main Campus S
- Page 144 and 145:
Bakersfield College - Delano Center
- Page 146 and 147:
Upon completion of the Student Serv
- Page 148 and 149:
Appendix B: State of California Eco
- Page 150 and 151:
Appendix C: Inter City Bakersfield
- Page 152 and 153:
Appendix D: Instructional Program A
- Page 154 and 155:
Appendix E: San Joaquin Valley Coll
- Page 156 and 157:
Source: California Virtual Campus.
- Page 158 and 159:
Appendix G: Bakersfield College- In
- Page 160 and 161:
Appendix G: Bakersfield College- In
- Page 162 and 163:
Appendix H: Bakersfield College Pro
- Page 164 and 165:
Appendix H: Bakersfield College Cer
- Page 166 and 167:
Appendix J: Bakersfield College- Ma
- Page 168 and 169:
Appendix J: Bakersfield College- Ma
- Page 170 and 171:
Appendix J: Bakersfield College- Ma
- Page 172 and 173:
Appendix K: Bakersfield College - D
- Page 174 and 175:
2012-13 Annual Program Review Educa
- Page 176 and 177:
2012-13 Annual Program Review Educa
- Page 178 and 179:
2012-13 Annual Program Review Educa
- Page 180 and 181:
2012-13 Annual Program Review Educa
- Page 182 and 183:
2012-13 Annual Program Review Educa
- Page 184 and 185:
2012-13 Annual Program Review Educa
- Page 186 and 187:
MONTHS OF INSTRUCTION JULY AUGUST 1
- Page 188 and 189:
Academic Development: Course Sample
- Page 190 and 191:
CRN Instructor Name Course Room Num
- Page 192 and 193:
English as a Second Language: Cours
- Page 194 and 195:
CRN Instructor Name Course Room Num
- Page 196 and 197:
CRN Instructor Name Course Room Num
- Page 198 and 199:
CRN Instructor Name Course Room Num
- Page 200 and 201:
CRN Instructor Name Course Room Num
- Page 202 and 203:
To: Chairs and Deans of Academic De
- Page 204 and 205:
Fall 2012 Student Course Placement
- Page 206 and 207:
Committee Name Staff Development Co
- Page 208 and 209:
Committee Name Information Services
- Page 210 and 211:
Action Plan Communication is an eve
- Page 214 and 215:
Kern Community College District Ser
- Page 216 and 217:
available Judy Fallert Curriculum S
- Page 218 and 219:
during the rest of the implementati
- Page 220 and 221:
o SCR001 (Reserved Words - Changed
- Page 222 and 223:
Registrar’s Report, Diagnostics R
- Page 224 and 225:
lock header or rule qualifier preve
- Page 226 and 227:
section and titles on all style she
- Page 228 and 229:
Go-Live Plan Training 3 We used the
- Page 230 and 231:
een devised for dealing with this i
- Page 232 and 233:
2/9/12 Begin to identify current re
- Page 234 and 235:
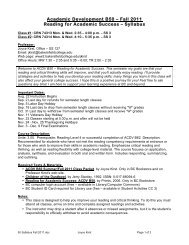
Welcome back to another great semes
- Page 236 and 237:
CCC Confer may be an unfamiliar sys
- Page 238 and 239:
1 ASSIST. FINANCIAL AID CLERICAL EO