Addendum with evidence (8.2 MB) - Accreditation - Bakersfield ...
Addendum with evidence (8.2 MB) - Accreditation - Bakersfield ...
Addendum with evidence (8.2 MB) - Accreditation - Bakersfield ...

You also want an ePaper? Increase the reach of your titles
YUMPU automatically turns print PDFs into web optimized ePapers that Google loves.
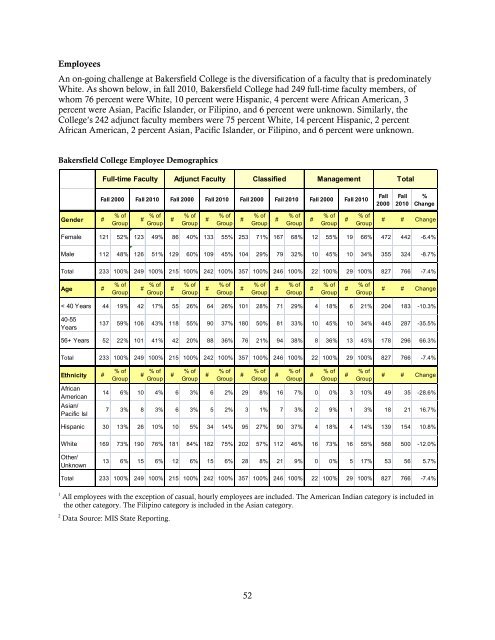
Employees<br />
An on-going challenge at <strong>Bakersfield</strong> College is the diversification of a faculty that is predominately<br />
White. As shown below, in fall 2010, <strong>Bakersfield</strong> College had 249 full-time faculty members, of<br />
whom 76 percent were White, 10 percent were Hispanic, 4 percent were African American, 3<br />
percent were Asian, Pacific Islander, or Filipino, and 6 percent were unknown. Similarly, the<br />
College’s 242 adjunct faculty members were 75 percent White, 14 percent Hispanic, 2 percent<br />
African American, 2 percent Asian, Pacific Islander, or Filipino, and 6 percent were unknown.<br />
<strong>Bakersfield</strong> College Employee Demographics<br />
Gender #<br />
% of<br />
Group<br />
1 All employees <strong>with</strong> the exception of casual, hourly employees are included. The American Indian category is included in<br />
the other category. The Filipino category is included in the Asian category.<br />
2 Data Source: MIS State Reporting.<br />
# % of<br />
Group<br />
#<br />
% of<br />
Group<br />
#<br />
% of<br />
Group<br />
#<br />
52<br />
% of<br />
Group<br />
#<br />
% of<br />
Group<br />
#<br />
% of<br />
Group<br />
#<br />
% of<br />
Group<br />
Fall<br />
2000<br />
Fall<br />
2010<br />
%<br />
Change<br />
# # Change<br />
Female 121 52% 123 49% 86 40% 133 55% 253 71% 167 68% 12 55% 19 66% 472 442 -6.4%<br />
Male 112 48% 126 51% 129 60% 109 45% 104 29% 79 32% 10 45% 10 34% 355 324 -8.7%<br />
Total 233 100% 249 100% 215 100% 242 100% 357 100% 246 100% 22 100% 29 100% 827 766 -7.4%<br />
Age #<br />
% of<br />
Group<br />
# % of<br />
Group<br />
#<br />
% of<br />
Group<br />
#<br />
% of<br />
Group<br />
#<br />
% of<br />
Group<br />
#<br />
% of<br />
Group<br />
#<br />
% of<br />
Group<br />
#<br />
% of<br />
Group<br />
# # Change<br />
< 40 Years 44 19% 42 17% 55 26% 64 26% 101 28% 71 29% 4 18% 6 21% 204 183 -10.3%<br />
40-55<br />
Years<br />
137 59% 106 43% 118 55% 90 37% 180 50% 81 33% 10 45% 10 34% 445 287 -35.5%<br />
56+ Years 52 22% 101 41% 42 20% 88 36% 76 21% 94 38% 8 36% 13 45% 178 296 66.3%<br />
Total 233 100% 249 100% 215 100% 242 100% 357 100% 246 100% 22 100% 29 100% 827 766 -7.4%<br />
Ethnicity #<br />
African<br />
American<br />
Asian/<br />
Pacific Isl<br />
% of<br />
Group<br />
# % of<br />
Group<br />
#<br />
% of<br />
Group<br />
#<br />
% of<br />
Group<br />
#<br />
% of<br />
Group<br />
#<br />
% of<br />
Group<br />
#<br />
% of<br />
Group<br />
#<br />
% of<br />
Group<br />
# # Change<br />
14 6% 10 4% 6 3% 6 2% 29 8% 16 7% 0 0% 3 10% 49 35 -28.6%<br />
7 3% 8 3% 6 3% 5 2% 3 1% 7 3% 2 9% 1 3% 18 21 16.7%<br />
Hispanic 30 13% 26 10% 10 5% 34 14% 95 27% 90 37% 4 18% 4 14% 139 154 10.8%<br />
White 169 73% 190 76% 181 84% 182 75% 202 57% 112 46% 16 73% 16 55% 568 500 -12.0%<br />
Other/<br />
Unknown<br />
Full-time Faculty Adjunct Faculty<br />
Classified<br />
Management Total<br />
Fall 2000 Fall 2010 Fall 2000 Fall 2010 Fall 2000 Fall 2010 Fall 2000 Fall 2010<br />
13 6% 15 6% 12 6% 15 6% 28 8% 21 9% 0 0% 5 17% 53 56 5.7%<br />
Total 233 100% 249 100% 215 100% 242 100% 357 100% 246 100% 22 100% 29 100% 827 766 -7.4%