Annual Report 2009-2010 - Department of Agriculture & Co-operation
Annual Report 2009-2010 - Department of Agriculture & Co-operation
Annual Report 2009-2010 - Department of Agriculture & Co-operation

You also want an ePaper? Increase the reach of your titles
YUMPU automatically turns print PDFs into web optimized ePapers that Google loves.
<strong>Annual</strong> <strong>Report</strong> <strong>2009</strong>-<strong>2010</strong><br />
2<br />
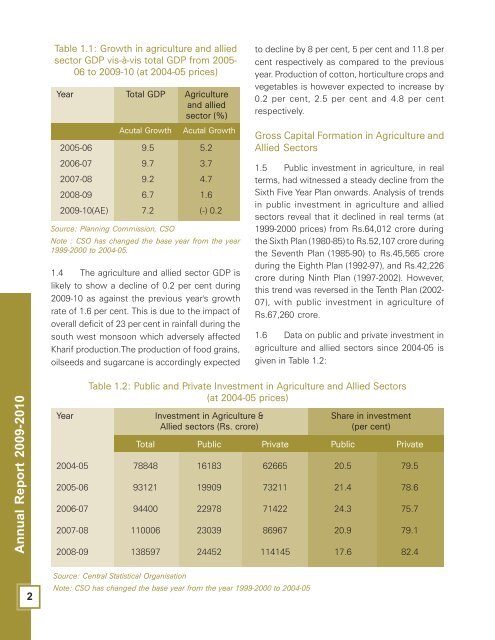
Table 1.1: Growth in agriculture and allied<br />
sector GDP vis-à-vis total GDP from 2005-<br />
06 to <strong>2009</strong>-10 (at 2004-05 prices)<br />
Year Total GDP <strong>Agriculture</strong><br />
and allied<br />
sector (%)<br />
Acutal Growth Acutal Growth<br />
2005-06 9.5 5.2<br />
2006-07 9.7 3.7<br />
2007-08 9.2 4.7<br />
2008-09 6.7 1.6<br />
<strong>2009</strong>-10(AE) 7.2 (-) 0.2<br />
Source: Planning <strong>Co</strong>mmission, CSO<br />
Note : CSO has changed the base year from the year<br />
1999-2000 to 2004-05.<br />
1.4 The agriculture and allied sector GDP is<br />
likely to show a decline <strong>of</strong> 0.2 per cent during<br />
<strong>2009</strong>-10 as against the previous year's growth<br />
rate <strong>of</strong> 1.6 per cent. This is due to the impact <strong>of</strong><br />
overall deficit <strong>of</strong> 23 per cent in rainfall during the<br />
south west monsoon which adversely affected<br />
Kharif production.The production <strong>of</strong> food grains,<br />
oilseeds and sugarcane is accordingly expected<br />
to decline by 8 per cent, 5 per cent and 11.8 per<br />
cent respectively as compared to the previous<br />
year. Production <strong>of</strong> cotton, horticulture crops and<br />
vegetables is however expected to increase by<br />
0.2 per cent, 2.5 per cent and 4.8 per cent<br />
respectively.<br />
Gross Capital Formation in <strong>Agriculture</strong> and<br />
Allied Sectors<br />
1.5 Public investment in agriculture, in real<br />
terms, had witnessed a steady decline from the<br />
Sixth Five Year Plan onwards. Analysis <strong>of</strong> trends<br />
in public investment in agriculture and allied<br />
sectors reveal that it declined in real terms (at<br />
1999-2000 prices) from Rs.64,012 crore during<br />
the Sixth Plan (1980-85) to Rs.52,107 crore during<br />
the Seventh Plan (1985-90) to Rs.45,565 crore<br />
during the Eighth Plan (1992-97), and Rs.42,226<br />
crore during Ninth Plan (1997-2002). However,<br />
this trend was reversed in the Tenth Plan (2002-<br />
07), with public investment in agriculture <strong>of</strong><br />
Rs.67,260 crore.<br />
1.6 Data on public and private investment in<br />
agriculture and allied sectors since 2004-05 is<br />
given in Table 1.2:<br />
Table 1.2: Public and Private Investment in <strong>Agriculture</strong> and Allied Sectors<br />
(at 2004-05 prices)<br />
Year Investment in <strong>Agriculture</strong> & Share in investment<br />
Allied sectors (Rs. crore) (per cent)<br />
Total Public Private Public Private<br />
2004-05 78848 16183 62665 20.5 79.5<br />
2005-06 93121 19909 73211 21.4 78.6<br />
2006-07 94400 22978 71422 24.3 75.7<br />
2007-08 110006 23039 86967 20.9 79.1<br />
2008-09 138597 24452 114145 17.6 82.4<br />
Source: Central Statistical Organisation<br />
Note: CSO has changed the base year from the year 1999-2000 to 2004-05