- Page 1 and 2: © Sepehr Ravati, 2010. UNIVERSITÉ
- Page 3 and 4: DEDICATED To my parents iii
- Page 5 and 6: RÉSUMÉ Cette thèse présente, po
- Page 7 and 8: devenir une structure hiérarchique
- Page 9 and 10: ABSTRACT This thesis presents, for
- Page 11 and 12: system can be increased from 10 -15
- Page 13 and 14: CONDENSÉ EN FRANÇAIS Dans ce trav
- Page 15 and 16: deuxième coquille de PS. Les phase
- Page 17 and 18: structures à percolation multiple
- Page 19 and 20: autre sous-type de morphologie dans
- Page 21 and 22: TABLE OF CONTENTS DEDICATION.......
- Page 23 and 24: xxiii 2.4.1.1.1 Charged Polymer Ads
- Page 25 and 26: 5.3.4 Annealing Test ..............
- Page 27 and 28: xxvii REFERENCES ..................
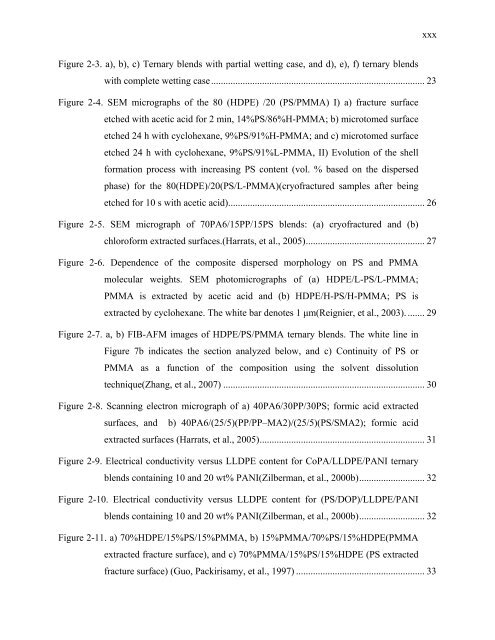
- Page 29: LIST OF FIGURES xxix Figure 1-1. a)
- Page 33 and 34: Figure 2-34. Schematic view of diff
- Page 35 and 36: Figure 4-8. SEM micrographs of vari
- Page 37 and 38: Figure 5-6. a),b) Scanning electron
- Page 39 and 40: and c) triangular concentration dia
- Page 41 and 42: n number of moles p concentration o
- Page 43 and 44: AFM atomic force microscopy LIST OF
- Page 45 and 46: PS-co-PMMA copolymer of PS and PMMA
- Page 47 and 48: 1.1 Introduction CHAPTER 1 - INTROD
- Page 49 and 50: Figure 1-2. Human heart, longitudin
- Page 51 and 52: One of the applications for porous
- Page 53 and 54: On the other hand, a novel tri-cont
- Page 55 and 56: 2.1 Polymer Blends CHAPTER 2 - LITE
- Page 57 and 58: Based on Sterling’s approximation
- Page 59 and 60: Antonoff’s rule (Equation 2-13) i
- Page 61 and 62: 2.1.2.1 Binary Polymer Blends 2.1.2
- Page 63 and 64: Some other studies(Everaert, Aerts,
- Page 65 and 66: where the parameter z is dependent
- Page 67 and 68: “compatibilization” was suggest
- Page 69 and 70: a) λ BC A and B are matrices, b) C
- Page 71 and 72: Reignier & Favis, 2000, 2003a; Reig
- Page 73 and 74: measure the interfacial tension of
- Page 75 and 76: a) b) Figure 2-6. Dependence of the
- Page 77 and 78: Omonov et al. found double percolat
- Page 79 and 80: 2.1.2.2.3 Effect of Composition on
- Page 81 and 82:
a) b) C B A c) Figure 2-12. SEM pho
- Page 83 and 84:
In the case where PS is the matrix,
- Page 85 and 86:
Posthuma de Boer, 1999) (Kumin & Ch
- Page 87 and 88:
lattice, such as square lattice, wi
- Page 89 and 90:
magnetization, which is a function
- Page 91 and 92:
Polymers have long been thought of
- Page 93 and 94:
epoxy as a function of nanotube wei
- Page 95 and 96:
Figure 2-19. Approaching the percol
- Page 97 and 98:
Figure 2-21. Transmission electron
- Page 99 and 100:
Figure 2-22: Dependence of PE conti
- Page 101 and 102:
Figure 2-24. Plot of the total numb
- Page 103 and 104:
chain provides the conductive path
- Page 105 and 106:
2.3.1.2.1 Polyaniline One of the mo
- Page 107 and 108:
CoPA/LLDPE/PANI blend and a poor-qu
- Page 109 and 110:
Narkis and co-workers extended and
- Page 111 and 112:
Figure 2-31: Conductivity of PVDF/P
- Page 113 and 114:
organic thin films, a novel and str
- Page 115 and 116:
on the topic have been reported in
- Page 117 and 118:
succeeded in creating thin films wi
- Page 119 and 120:
Addition of salt to the solution of
- Page 121 and 122:
different from that of linear homop
- Page 123 and 124:
Figure 2-39. Macromolecule with a)
- Page 125 and 126:
polyanion such as hyaluronan (HA)(P
- Page 127 and 128:
2.4.1.1.7 Effect of Salt on Multila
- Page 129 and 130:
2.4.1.1.8 Overcompensation of the M
- Page 131 and 132:
important factors determining the g
- Page 133 and 134:
As shown in Figure 2-44, swelling a
- Page 135 and 136:
increasing the pH value due to a de
- Page 137 and 138:
CHAPTER 3 - ORGANIZATION OF THE ART
- Page 139 and 140:
discussed above, HDPE, PS, PMMA, an
- Page 141 and 142:
CHAPTER 4 - LOW PERCOLATION THRESHO
- Page 143 and 144:
or model which predicts where the p
- Page 145 and 146:
concentration threshold for the ons
- Page 147 and 148:
chemical and weathering resistance,
- Page 149 and 150:
Table 4-1. Material Characteristics
- Page 151 and 152:
filled with blend pellets. To facil
- Page 153 and 154:
4.3.6 Conductivity Measurements DC
- Page 155 and 156:
experimentally in this research gro
- Page 157 and 158:
a) b) c) d) Figure 4-4. Schematic i
- Page 159 and 160:
microstructure of the quaternary bl
- Page 161 and 162:
a) b) c) d) Figure 4-6. SEM microgr
- Page 163 and 164:
a) b) PVDF PS PMMA c) d) e) HDPE PS
- Page 165 and 166:
Uniform layers of PS and PMMA situa
- Page 167 and 168:
the concentration of HDPE is increa
- Page 169 and 170:
a) b) c) e) Figure 4-11. SEM microg
- Page 171 and 172:
melt-processable and contains 25 wt
- Page 173 and 174:
One question that should be address
- Page 175 and 176:
Conductivity(S/cm) Ternary Blend 1,
- Page 177 and 178:
phase(PMMA), the concentration of P
- Page 179 and 180:
(6) Virgilio, N.; Desjardins, P.; L
- Page 181 and 182:
ONION MORPHOLOGY HDPE PVDF PS Contr
- Page 183 and 184:
work described above has focused on
- Page 185 and 186:
thermodynamic explanation to predic
- Page 187 and 188:
four-point probe increases continuo
- Page 189 and 190:
in the rheology tests were compress
- Page 191 and 192:
5.3.6 Layer-by-Layer Deposition The
- Page 193 and 194:
prepare a polymer blend structure w
- Page 195 and 196:
a) b) c) Figure 5-3. Scanning elect
- Page 197 and 198:
spontaneously self-assembled. After
- Page 199 and 200:
a) b) c) d) e) f) g) h) Figure 5-5.
- Page 201 and 202:
Since the ultra-low surface area va
- Page 203 and 204:
c) a) b) Figure 5-6. a),b) Scanning
- Page 205 and 206:
salt to a PSS polyelectrolyte solut
- Page 207 and 208:
A relationship between macropore si
- Page 209 and 210:
close together. It is interesting t
- Page 211 and 212:
Figure 5-9. Mass increase (%) indic
- Page 213 and 214:
In this work the conductance of the
- Page 215 and 216:
deposited PANI layers increases unt
- Page 217 and 218:
(52) Guo, H. F.; Packirisamy, S.; G
- Page 219 and 220:
6.2 Introduction It is well-known t
- Page 221 and 222:
modified version of Harkins theory(
- Page 223 and 224:
6.3 Experimental 6.3.1 Materials Co
- Page 225 and 226:
Complex voscosity (Pa.s) 1,0E+04 1,
- Page 227 and 228:
6.3.5.2 Focused Ion Beam (FIB) and
- Page 229 and 230:
a) c) b) d) e) f) PMMA PMMA HDPE HD
- Page 231 and 232:
y Harkins theory, PS will always si
- Page 233 and 234:
a) b) c) d) e) f) PS Figure 6-6. a)
- Page 235 and 236:
a) b) HDPE : black PS : grey PMMA :
- Page 237 and 238:
6.4.6 Continuity, Co-continuity, an
- Page 239 and 240:
c) V III II I VII I IV VI Figure 6-
- Page 241 and 242:
Continuity Scheme (a) Figure 6-10.
- Page 243 and 244:
Addition of a low concentration of
- Page 245 and 246:
Addition of small amounts of HDPE t
- Page 247 and 248:
icontinuous network with the HDPE.
- Page 249 and 250:
Three examples are shown in Figure
- Page 251 and 252:
(9) Mekhilef, N.; Verhoogt, H. Poly
- Page 253 and 254:
structures are formed due to the co
- Page 255 and 256:
CONCLUSION AND RECOMMENDATIONS In t
- Page 257 and 258:
REFERENCES A. K. Gupta, K. R. S. (1
- Page 259 and 260:
Caruso, F. (2003). Hollow Inorganic
- Page 261 and 262:
Domenech, S. C., Bortoluzzi, J. H.,
- Page 263 and 264:
Geuskens, G., Gielens, J. L., Geshe
- Page 265 and 266:
Hou, S., Harrell, C. C., Trofin, L.
- Page 267 and 268:
Krass, H., Papastavrou, G., & Kurth
- Page 269 and 270:
Macdiarmid, A. G., Jin-Chih, C., Ha
- Page 271 and 272:
Niziol, J., & Laska, J. (1999). Con
- Page 273 and 274:
Reghu, M., Yoon, C. O., Yang, C. Y.
- Page 275 and 276:
Shirakawa, H., Louis, E. L., MacDia
- Page 277 and 278:
Utracki, L. A. (1991). On the visco
- Page 279 and 280:
Yasuda, K., Armstrong, R., & Cohen,
- Page 281 and 282:
literature has examined factors inf
- Page 283 and 284:
(Reignier & Favis, 2000, 2003a; Rei
- Page 285 and 286:
Table A-1.2. Interfacial tensions a
- Page 287 and 288:
acquisition of images with a very h
- Page 289 and 290:
Table A-1.3. Continuity of the PMMA
- Page 291 and 292:
(17) Reignier, J.; Favis, B. D., Ma
- Page 293 and 294:
PANI. Theoretically, the extent of
- Page 295 and 296:
Equation A-2.7 0( ) 0 1. 5 σ = σ
- Page 297 and 298:
Cumulative Mass × 10 5 (g) dipping
- Page 299 and 300:
of PANI, and an increase in the con
- Page 301 and 302:
Resistance(ohm) 1.0E+12 1.0E+11 1.0
- Page 303 and 304:
esistance value. Samples containing
- Page 305 and 306:
The results of resistance for PS/PE
- Page 307 and 308:
Caruso, F., & Schuler, C. (2000). E


