Protein Expression and Purification Series - Bio-Rad
Protein Expression and Purification Series - Bio-Rad
Protein Expression and Purification Series - Bio-Rad

Create successful ePaper yourself
Turn your PDF publications into a flip-book with our unique Google optimized e-Paper software.
<strong>Protein</strong> <strong>Expression</strong> <strong>and</strong> <strong>Purification</strong> <strong>Series</strong><br />
3.<br />
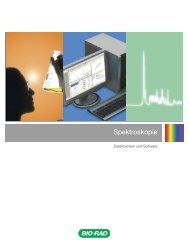
While the pump is running, look at the GP-Pressure curve (Figure 8.13) <strong>and</strong> determine if the pressure<br />
is even.<br />
4. While there might be small oscillations, there should be no large variances. If there are large<br />
fluctuations (such as going from 50 psi to 18 psi <strong>and</strong> back), this means there are air bubbles in the<br />
lines <strong>and</strong> you will need to stop. Stop the pump. Prime Inlet line B again, following the protocols in Step<br />
1 <strong>and</strong> then start Pump B again.<br />
5.<br />
Once there are no air bubbles in the line (no pressure fluctuations), record the UV absorbance <strong>and</strong><br />
conductivity values from the bottom of the Manual screen <strong>and</strong> then stop the pump.<br />
UV _______________________ Conductivity _____________________________<br />
Figure 8.13. Manual wash with 100% B. Imidazole absorbs at 280 nm so you should see a UV value less than 0.5. Buffer B<br />
contains a high level of salt (300 mM NaCl <strong>and</strong> 20 mM sodium phosphate) that contributes to the main portion of the conductivity<br />
value. Imidazole contributes some conductivity, but is not a strong ionic species <strong>and</strong> hence contributes much less to the overall<br />
conductivity. The conductivity range expected after the 100% Buffer B wash is between 35–55 mS/cm. The chromatogram shows<br />
equilibration of the UV trace, conductivity trace, <strong>and</strong> pressure reading with the curves that go flat (note the Y-axes have been<br />
exp<strong>and</strong>ed for easier viewing).<br />
6.<br />
Set the buffer composition to 98% Inlet A <strong>and</strong> 2% Inlet B. Leave the flow rate at 2.00 ml/min <strong>and</strong> the<br />
high <strong>and</strong> low pressure limits at 200 psi <strong>and</strong> 0 psi respectively.<br />
7. Press the Start button <strong>and</strong> equilibrate the system for five minutes (or 10 CV).<br />
8. While the pump is running, look at the GP-Pressure curve (Figure 8.14) <strong>and</strong> determine if the pressure<br />
is even.<br />
9. While there might be small oscillations, there should be no large ones. If there are large fluctuations<br />
(such as going from 50 psi to 18 psi <strong>and</strong> back), this means there are air bubbles in the lines <strong>and</strong> you<br />
will need to stop the pumps. Prime Inlet line A again following the protocols in Step 1 <strong>and</strong> then start<br />
the pumps again.<br />
10. After five minutes of equilibration with 2% Buffer B, record the UV <strong>and</strong> Conductivity values <strong>and</strong> then<br />
stop the pump.<br />
Chapter 8: <strong>Purification</strong> Protocol for <strong>Bio</strong>Logic DuoFlow System<br />
175<br />
% B<br />
Conductivity<br />
UV<br />
Pressure<br />
UV _______________________ Conductivity _____________________________<br />
CHAPTER 8<br />
BIOLOGIC DUOFLOW<br />
PROTOCOL