Protein Expression and Purification Series - Bio-Rad
Protein Expression and Purification Series - Bio-Rad
Protein Expression and Purification Series - Bio-Rad

You also want an ePaper? Increase the reach of your titles
YUMPU automatically turns print PDFs into web optimized ePapers that Google loves.
CHAPTER 9<br />
DHFR ENZYMATIC<br />
ASSAY<br />
<strong>Protein</strong> <strong>Expression</strong> <strong>and</strong> <strong>Purification</strong> <strong>Series</strong><br />
Absorbance at 340 nm<br />
c. Convert this slope from change in absorbance at 340 nm/second to change in absorbance at<br />
340 nm/minute by multiplying by 60.<br />
Slope of Control Data x 60 = _____________ Change in Absorbance at 340 nm/minute<br />
This will now be referred to as ΔOD, control.<br />
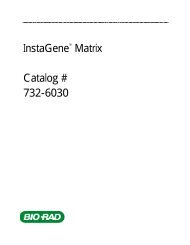
d. Look at your data from the “GST-DHFR-His Enzyme Reaction.” Plot the data with the x-axis as Time<br />
in seconds <strong>and</strong> the y-axis as Absorbance at 340 nm. Example data is pictured in Figure 9.4.<br />
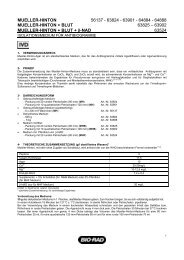
Note: Ideally, the enzyme reaction data should be linear over the entire range of 150 seconds. As<br />
the reaction is set up, it is limited by the amount of DHF. Therefore, if there is a lot more enzyme than<br />
substrate, the substrate will be used up before the 150 seconds is over, <strong>and</strong> the absorbance will not<br />
change appreciably for the remainder of the time course (Figure 9.5). If this is the case, calculate the<br />
rate only for data before it flatlines (at 95 seconds in figure 9.5 below). If there are enough reagents<br />
available, you can also try diluting your GST-DHFR-His sample in 1x PBS <strong>and</strong> rerunning the entire<br />
enzyme reaction.<br />
0.680<br />
0.670<br />
0.660<br />
0.650<br />
0.640<br />
0.630<br />
0.620<br />
Absorbance at 340 nm<br />
0.610<br />
GST-DHFR-His G S T -D H F R -HEnzyme is E n z yReaction m e R e a c tio n<br />
0.600<br />
0 20 40 60 80 100 120 140 160<br />
Time T ime in in seconds se conds<br />
Figure 9.4. GST-DHFR-His enzyme reaction. When substrate, enzyme <strong>and</strong> cofactor are present, the absorbance of the NADPH at<br />
340 nm should decrease if the enzyme is active since the NADPH is being converted to NADP+. From a regression analysis of the<br />
above data, the change in absorbance at 340 nm/minute is -4.5x10 -4 /second or -0.027/min.<br />
Absorbance at 340 nm<br />
0.540<br />
0.530<br />
0.520<br />
0.510<br />
0.500<br />
0.490<br />
Absorbance at 340 nm<br />
0.480<br />
GST-DHFR-His G S T -D H F R -HEnzyme is E n zReaction y m e R e a c tio n<br />
0.470<br />
0 20 40 60 80 100 120 140 160<br />
Time T ime in in seconds se condsq<br />
Figure 9.5. A reaction with too much GST-DHFR-His enzyme. This reaction flatlines, or runs out of DHF, by 95 seconds. After<br />
that, the absorbance does not change. The timeframe after 95 seconds is analogous to the No DHF Substrate Control reaction since<br />
in that reaction, no DHF was added; while in the above reaction, the GST-DHFR-His converted all the DHF present to THF so there<br />
was no more need to convert the NADPH to NADP + <strong>and</strong> the absorbance values level off. To calculate the rate of the enzyme reaction<br />
for this data, the slope of only the data from 0-75 seconds should be used or the GST-DHFR-His should be diluted <strong>and</strong> the reaction<br />
run again if there are enough reagents available.<br />
206 Chapter 9: DHFR Enzymatic Activity Assay Student Protocol