- Page 1:
UNIVERSITAT POLITÈCNICA DE VALÈNC
- Page 5 and 6:
Agraïments A Chelo González per t
- Page 7 and 8:
RESUMEN La tesis doctoral tiene com
- Page 9:
Dentro del amplio abanico de propie
- Page 12 and 13:
colonies forming units per mL is re
- Page 14 and 15:
En el disseny i optimització del p
- Page 17 and 18:
ÍNDICE PÁGINA Justificación e in
- Page 19 and 20:
Justificación e interés del traba
- Page 21:
pretende que el producto fermentado
- Page 25 and 26:
I. Introducción 9 En la introducci
- Page 27:
Vegetable milks and fermented deriv
- Page 30 and 31:
14 I. Introducción 1. INTRODUCTION
- Page 32 and 33:
16 I. Introducción able to adapt t
- Page 34 and 35:
18 I. Introducción large quantitie
- Page 36 and 37:
20 I. Introducción observe signifi
- Page 38 and 39:
22 I. Introducción Table 1. Raw ma
- Page 40 and 41:
24 I. Introducción Table 2. Main f
- Page 42 and 43:
26 I. Introducción KAMUT (cereal)
- Page 44 and 45:
28 I. Introducción Spelt (cereal)
- Page 46 and 47:
30 I. Introducción Husked cereals
- Page 48 and 49:
32 I. Introducción or sucralose) a
- Page 50 and 51:
(1) Nutriops S.L. (Spain) (2) Soria
- Page 52 and 53:
36 I. Introducción animal milks an
- Page 54 and 55:
38 I. Introducción with great sens
- Page 56 and 57:
40 I. Introducción and Streptococc
- Page 58 and 59:
42 I. Introducción prebiotics such
- Page 60 and 61:
44 I. Introducción new generation
- Page 62 and 63:
46 I. Introducción In the developm
- Page 64 and 65:
48 I. Introducción Biel W, Bobko K
- Page 66 and 67:
50 I. Introducción Chisholm A, Man
- Page 68 and 69:
52 I. Introducción Dykes L and Roo
- Page 70 and 71:
54 I. Introducción Jing P and Hu X
- Page 72 and 73:
56 I. Introducción Mattes RD, Kris
- Page 74 and 75:
58 I. Introducción Philips KM, Rug
- Page 76 and 77:
60 I. Introducción Sharma A and Ka
- Page 78 and 79:
62 I. Introducción Wu WH, Kang YP,
- Page 81 and 82:
II. Contribución científica del t
- Page 83:
III. OBJETIVOS
- Page 86 and 87:
70 III.Objetivos 70 III. Objetivos
- Page 89 and 90:
IV. Resultados y discusión 73 Se s
- Page 91 and 92:
IV. Resultados y discusión 75 micr
- Page 93:
Capítulo I Elección de las “lec
- Page 97 and 98:
IV. Resultados y discusión. Capít
- Page 99 and 100:
IV. Resultados y discusión. Capít
- Page 101 and 102:
IV. Resultados y discusión. Capít
- Page 103 and 104:
IV. Resultados y discusión. Capít
- Page 105 and 106:
IV. Resultados y discusión. Capít
- Page 107 and 108:
% Volume particles number (%) % Vol
- Page 109 and 110: IV. Resultados y discusión. Capít
- Page 111 and 112: IV. Resultados y discusión. Capít
- Page 113 and 114: IV. Resultados y discusión. Capít
- Page 115 and 116: IV. Resultados y discusión. Capít
- Page 117 and 118: IV. Resultados y discusión. Capít
- Page 119 and 120: IV. Resultados y discusión. Capít
- Page 121 and 122: IV. Resultados y discusión. Capít
- Page 123 and 124: IV. Resultados y discusión. Capít
- Page 125 and 126: IV. Resultados y discusión. Capít
- Page 127 and 128: IV. Resultados y discusión. Capít
- Page 129: Capítulo II Diseño y optimizació
- Page 133 and 134: IV.Resultados y discusión. Capítu
- Page 135 and 136: IV.Resultados y discusión. Capítu
- Page 137 and 138: IV.Resultados y discusión. Capítu
- Page 139 and 140: IV.Resultados y discusión. Capítu
- Page 141 and 142: IV.Resultados y discusión. Capítu
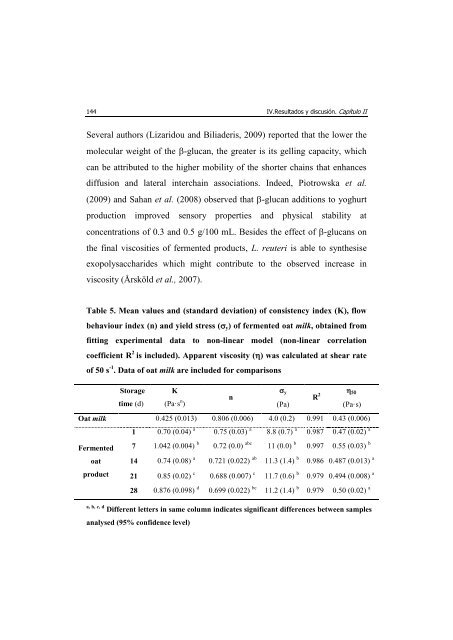
- Page 143 and 144: IV.Resultados y discusión. Capítu
- Page 145 and 146: IV.Resultados y discusión. Capítu
- Page 147 and 148: IV.Resultados y discusión. Capítu
- Page 149 and 150: IV.Resultados y discusión. Capítu
- Page 151 and 152: IV.Resultados y discusión. Capítu
- Page 153 and 154: IV.Resultados y discusión. Capítu
- Page 155 and 156: IV.Resultados y discusión. Capítu
- Page 157 and 158: IV.Resultados y discusión. Capítu
- Page 159: IV.Resultados y discusión. Capítu
- Page 163 and 164: IV.Resultados y discusión. Capítu
- Page 165 and 166: IV.Resultados y discusión. Capítu
- Page 167 and 168: IV.Resultados y discusión. Capítu
- Page 169 and 170: IV.Resultados y discusión. Capítu
- Page 171: Development of a non-dairy probioti
- Page 174 and 175: 158 IV.Resultados y discusión. Cap
- Page 176 and 177: 160 IV.Resultados y discusión. Cap
- Page 178 and 179: 162 IV.Resultados y discusión. Cap
- Page 180 and 181: 164 IV.Resultados y discusión. Cap
- Page 182 and 183: 166 IV.Resultados y discusión. Cap
- Page 184 and 185: 168 IV.Resultados y discusión. Cap
- Page 186 and 187: 170 IV.Resultados y discusión. Cap
- Page 188 and 189: 172 IV.Resultados y discusión. Cap
- Page 190 and 191: 174 IV.Resultados y discusión. Cap
- Page 192 and 193: 176 IV.Resultados y discusión. Cap
- Page 194 and 195: 178 IV.Resultados y discusión. Cap
- Page 196 and 197: 180 IV.Resultados y discusión. Cap
- Page 198 and 199: 182 IV.Resultados y discusión. Cap
- Page 200 and 201: t (Pa) 184 IV.Resultados y discusi
- Page 202 and 203: 186 IV.Resultados y discusión. Cap
- Page 204 and 205: 188 IV.Resultados y discusión. Cap
- Page 206 and 207: 190 IV.Resultados y discusión. Cap
- Page 208 and 209: 192 IV.Resultados y discusión. Cap
- Page 210 and 211:
194 IV.Resultados y discusión. Cap
- Page 213:
Hazelnut milk fermentation using pr
- Page 216 and 217:
200 IV.Resultados y discusión. Cap
- Page 218 and 219:
202 IV.Resultados y discusión. Cap
- Page 220 and 221:
204 IV.Resultados y discusión. Cap
- Page 222 and 223:
206 IV.Resultados y discusión. Cap
- Page 224 and 225:
208 IV.Resultados y discusión. Cap
- Page 226 and 227:
210 IV.Resultados y discusión. Cap
- Page 228 and 229:
212 IV.Resultados y discusión. Cap
- Page 230 and 231:
214 IV.Resultados y discusión. Cap
- Page 232 and 233:
216 IV.Resultados y discusión. Cap
- Page 234 and 235:
218 IV.Resultados y discusión. Cap
- Page 236 and 237:
220 IV.Resultados y discusión. Cap
- Page 238 and 239:
222 IV.Resultados y discusión. Cap
- Page 240 and 241:
224 IV.Resultados y discusión. Cap
- Page 242 and 243:
t (Pa) 226 IV.Resultados y discusi
- Page 244 and 245:
228 IV.Resultados y discusión. Cap
- Page 246 and 247:
230 IV.Resultados y discusión. Cap
- Page 248 and 249:
232 IV.Resultados y discusión. Cap
- Page 250 and 251:
234 IV.Resultados y discusión. Cap
- Page 252 and 253:
236 IV.Resultados y discusión. Cap
- Page 254 and 255:
238 IV.Resultados y discusión. Cap
- Page 256 and 257:
240 IV.Resultados y discusión. Cap
- Page 258 and 259:
242 IV.Resultados y discusión. Cap
- Page 261:
Capítulo III Posibles efectos func
- Page 265 and 266:
IV. Resultados y discusión. Capít
- Page 267 and 268:
IV. Resultados y discusión. Capít
- Page 269 and 270:
IV. Resultados y discusión. Capít
- Page 271 and 272:
IV. Resultados y discusión. Capít
- Page 273 and 274:
IV. Resultados y discusión. Capít
- Page 275 and 276:
IV. Resultados y discusión. Capít
- Page 277 and 278:
IV. Resultados y discusión. Capít
- Page 279 and 280:
% of total A IV. Resultados y discu
- Page 281 and 282:
IV. Resultados y discusión. Capít
- Page 283 and 284:
IV. Resultados y discusión. Capít
- Page 285 and 286:
IV. Resultados y discusión. Capít
- Page 287 and 288:
IL-8 concentration (ng/mL) IV. Resu
- Page 289 and 290:
IV. Resultados y discusión. Capít
- Page 291 and 292:
IV. Resultados y discusión. Capít
- Page 293 and 294:
IV. Resultados y discusión. Capít
- Page 295:
IV. Resultados y discusión. Capít
- Page 299 and 300:
IV. Resultados y discusión. Capít
- Page 301 and 302:
IV. Resultados y discusión. Capít
- Page 303 and 304:
IV. Resultados y discusión. Capít
- Page 305 and 306:
IV. Resultados y discusión. Capít
- Page 307 and 308:
IV. Resultados y discusión. Capít
- Page 309 and 310:
IV. Resultados y discusión. Capít
- Page 311 and 312:
IV. Resultados y discusión. Capít
- Page 313 and 314:
IV. Resultados y discusión. Capít
- Page 315 and 316:
IV. Resultados y discusión. Capít
- Page 317 and 318:
IV. Resultados y discusión. Capít
- Page 319 and 320:
IV. Resultados y discusión. Capít
- Page 321 and 322:
IV. Resultados y discusión. Capít
- Page 323:
IV. Resultados y discusión. Capít
- Page 327 and 328:
Conclusiones ‣ Las altas presione
- Page 329 and 330:
de los yogures convencionales, espe
- Page 331:
leche de vaca, vegetarianos…). De