Santander, February 19th-22nd 2008 - Aranzadi
Santander, February 19th-22nd 2008 - Aranzadi
Santander, February 19th-22nd 2008 - Aranzadi

You also want an ePaper? Increase the reach of your titles
YUMPU automatically turns print PDFs into web optimized ePapers that Google loves.
212<br />
ELOÍSA BERNÁLDEZ & ESTEBAN GARCÍA-VIÑAS<br />
be observed. In order to detect the existence of a<br />
relationship between oyster valves size and<br />
Seville’s population through time we have applied<br />
Spearman's rank correlation coefficient.<br />
5. RESULTS: VARIATION IN THE SIZE OF OYS-<br />
TERS FROM SEVILLIAN ARCHAEOLOGICAL<br />
DEPOSITS DATING FROM THE 15 TH AND 17 TH<br />
CENTURIES<br />
During the years of collection of malacological<br />
material, we have noticed that the average size of<br />
valves and snails reaches, at least, the optimum<br />
size when they are destined for consumption; and<br />
that, as has been proved in (Bernáldez et al. <strong>2008</strong>),<br />
although the emplacement of the deposit can<br />
favour the mixture of elements from non anthropic<br />
activities, it is obvious that collectors picked the<br />
biggest elements if the energy balance –the ratio<br />
between the energy supplied by the food and the<br />
energy spent in obtaining it- is positive (Valverde<br />
1967). Nowadays (2001), the Consejería de<br />
Agricultura y Pesca de la Junta de Andalucía<br />
(Andalusian Government on Agriculture and<br />
Fishing) determines the minimum consumption<br />
size for oysters from our coasts in 80 mm.<br />
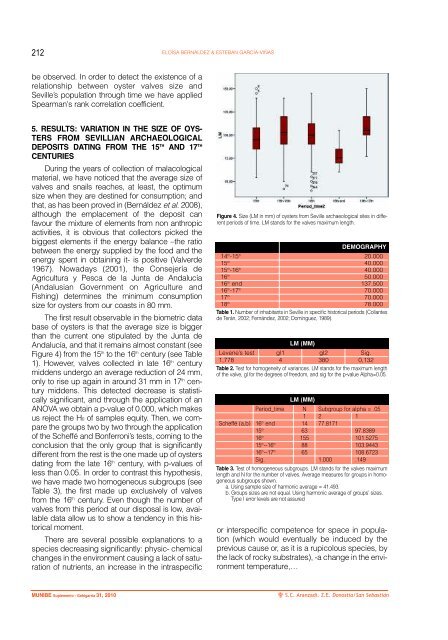
The first result observable in the biometric data<br />
base of oysters is that the average size is bigger<br />
than the current one stipulated by the Junta de<br />
Andalucía, and that it remains almost constant (see<br />
Figure 4) from the 15 th to the 16 th century (see Table<br />
1). However, valves collected in late 16 th century<br />
middens undergo an average reduction of 24 mm,<br />
only to rise up again in around 31 mm in 17 th century<br />
middens. This detected decrease is statistically<br />
significant, and through the application of an<br />
ANOVA we obtain a p-value of 0.000, which makes<br />
us reject the H0 of samples equity. Then, we compare<br />
the groups two by two through the application<br />
of the Scheffé and Bonferroni’s tests, coming to the<br />
conclusion that the only group that is significantly<br />
different from the rest is the one made up of oysters<br />
dating from the late 16 th century, with p-values of<br />
less than 0.05. In order to contrast this hypothesis,<br />
we have made two homogeneous subgroups (see<br />
Table 3), the first made up exclusively of valves<br />
from the 16 th century. Even though the number of<br />
valves from this period at our disposal is low, available<br />
data allow us to show a tendency in this historical<br />
moment.<br />
There are several possible explanations to a<br />
species decreasing significantly: physic- chemical<br />
changes in the environment causing a lack of saturation<br />
of nutrients, an increase in the intraspecific<br />
Figure 4. Size (LM in mm) of oysters from Seville archaeological sites in different<br />
periods of time. LM stands for the valves maximum length.<br />
14 th -15 th 20.000<br />
15 th 40.000<br />
15 th -16 th 40.000<br />
16 th 50.000<br />
16 th end 137.500<br />
16 th -17 th 70.000<br />
17 th 70.000<br />
18 th 78.000<br />
Table 1. Number of inhabitants in Seville in specific historical periods (Collantes<br />
de Terán, 2002; Fernández, 2002; Domínguez, 1989).<br />
LM (MM)<br />
DEMOGRAPHY<br />
Levene’s test gl1 gl2 Sig.<br />
1,778 4 380 0,132<br />
Table 2. Test for homogeneity of variances. LM stands for the maximum length<br />
of the valve, gl for the degrees of freedom, and sig for the p-value Alpha=0.05.<br />
LM (MM)<br />
Period_time N Subgroup for alpha = .05<br />
1 2 1<br />
Scheffé (a,b) 16 th end 14 77.8171<br />
15 th 63 97.8389<br />
16 th 155 101.5275<br />
15 th --16 th 88 103.9443<br />
16 th --17 th 65 108.6723<br />
Sig. 1.000 .149<br />
Table 3. Test of homogeneous subgroups. LM stands for the valves maximum<br />
length and N for the number of valves. Average measures for groups in homogeneous<br />
subgroups shown.<br />
a. Using sample size of harmonic average = 41.493.<br />
b. Groups sizes are not equal. Using harmonic average of groups’ sizes.<br />
Type I error levels are not assured<br />
or interspecific competence for space in population<br />
(which would eventually be induced by the<br />
previous cause or, as it is a rupicolous species, by<br />
the lack of rocky substrates), -a change in the environment<br />
temperature,…<br />
MUNIBE Suplemento - Gehigarria 31, 2010<br />
S.C. <strong>Aranzadi</strong>. Z.E. Donostia/San Sebastián