Santander, February 19th-22nd 2008 - Aranzadi
Santander, February 19th-22nd 2008 - Aranzadi
Santander, February 19th-22nd 2008 - Aranzadi

Create successful ePaper yourself
Turn your PDF publications into a flip-book with our unique Google optimized e-Paper software.
The U.S. Freshwater Shell Button Industry<br />
305<br />
The techniques used to harvest mussels from<br />
their beds were adopted from the musseling<br />
industry of Europe and varied in their efficiency<br />
and damage to the beds. Most common were<br />
hand collection, raking, brailing, and the use of<br />
dredges. Brailing and hand collecting began in the<br />
late 1880s. Brailing refers to the dragging of multitons<br />
in 6 months in 1912. A 50 ton pile was recorded<br />
in the Pekin area. Havanna had a 30 ton pile<br />
in 1912, and “hundreds of tons” were shipped from<br />
the Bath area that year. Four thousand tons were<br />
harvested in the beds from Meredosia to Naples in<br />
1909, while in 1912, 850 tons were gleaned. From<br />
the Valley City area came 200 tons in 1910 and 93<br />
tons in 1912. Bedford had 28 tons in 1912, Pearl<br />
had 168 tons, and 30 tons were sold just north of<br />
Kampsville in 1912. Buyers bought 1000 tons in<br />
1908 from Hardin, but only 5 tons in 1912, 122 tons<br />
at Grafton; 600 tons in 1911 and at least another<br />
600 tons in 1912 from Gatlin (Danglade 1914).<br />
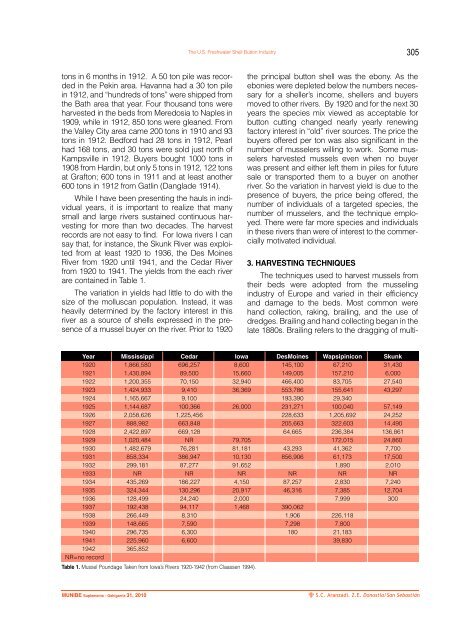
While I have been presenting the hauls in individual<br />
years, it is important to realize that many<br />
small and large rivers sustained continuous harvesting<br />
for more than two decades. The harvest<br />
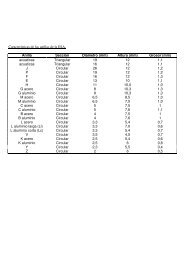
records are not easy to find. For Iowa rivers I can<br />
say that, for instance, the Skunk River was exploited<br />
from at least 1920 to 1936, the Des Moines<br />
River from 1920 until 1941, and the Cedar River<br />
from 1920 to 1941. The yields from the each river<br />
are contained in Table 1.<br />
The variation in yields had little to do with the<br />
size of the molluscan population. Instead, it was<br />
heavily determined by the factory interest in this<br />
river as a source of shells expressed in the presence<br />
of a mussel buyer on the river. Prior to 1920<br />
the principal button shell was the ebony. As the<br />
ebonies were depleted below the numbers necessary<br />
for a sheller’s income, shellers and buyers<br />
moved to other rivers. By 1920 and for the next 30<br />
years the species mix viewed as acceptable for<br />
button cutting changed nearly yearly renewing<br />
factory interest in “old” river sources. The price the<br />
buyers offered per ton was also significant in the<br />
number of musselers willing to work. Some musselers<br />
harvested mussels even when no buyer<br />
was present and either left them in piles for future<br />
sale or transported them to a buyer on another<br />
river. So the variation in harvest yield is due to the<br />
presence of buyers, the price being offered, the<br />
number of individuals of a targeted species, the<br />
number of musselers, and the technique employed.<br />
There were far more species and individuals<br />
in these rivers than were of interest to the commercially<br />
motivated individual.<br />
3. HARVESTING TECHNIQUES<br />
Year Mississippi Cedar Iowa DesMoines Wapsipinicon Skunk<br />
1920 1,866,580 696,257 8,600 145,100 67,210 31,430<br />
1921 1,430,894 89,500 15,660 149,005 157,210 6,000<br />
1922 1,200,355 70,150 32,940 466,400 83,705 27,540<br />
1923 1,424,933 9,410 36,369 553,786 155,641 43,297<br />
1924 1,165,667 9,100 193,390 29,340<br />
1925 1,144,687 100,366 26,000 231,271 100,040 57,149<br />
1926 2,058,626 1,225,456 228,633 1,205,692 24,252<br />
1927 888,982 663,848 205,663 322,603 14,490<br />
1928 2,422,897 669,128 64,665 236,384 136,861<br />
1929 1,020,484 NR 79,705 172,015 24,860<br />
1930 1,482,679 76,281 81,181 43,293 41,362 7,700<br />
1931 858,334 386,947 10,130 856,906 61,173 17,500<br />
1932 299,181 87,277 91,652 1,890 2,010<br />
1933 NR NR NR NR NR NR<br />
1934 435,269 186,227 4,150 87,257 2,830 7,240<br />
1935 324,344 130,296 20,917 46,316 7,385 12,704<br />
1936 128,499 24,240 2,000 7,999 300<br />
1937 192,438 94,117 1,468 390,062<br />
1938 266,449 8,310 1,906 226,118<br />
1939 148,665 7,590 7,298 7,800<br />
1940 296,735 6,300 180 21,183<br />
1941 225,960 6,600 39,830<br />
1942 365,852<br />
NR=no record<br />
Table 1. Mussel Poundage Taken from Iowa’s Rivers 1920-1942 (from Claassen 1994).<br />
MUNIBE Suplemento - Gehigarria 31, 2010<br />
S.C. <strong>Aranzadi</strong>. Z.E. Donostia/San Sebastián