Hedging Strategy and Electricity Contract Engineering - IFOR
Hedging Strategy and Electricity Contract Engineering - IFOR
Hedging Strategy and Electricity Contract Engineering - IFOR

Create successful ePaper yourself
Turn your PDF publications into a flip-book with our unique Google optimized e-Paper software.
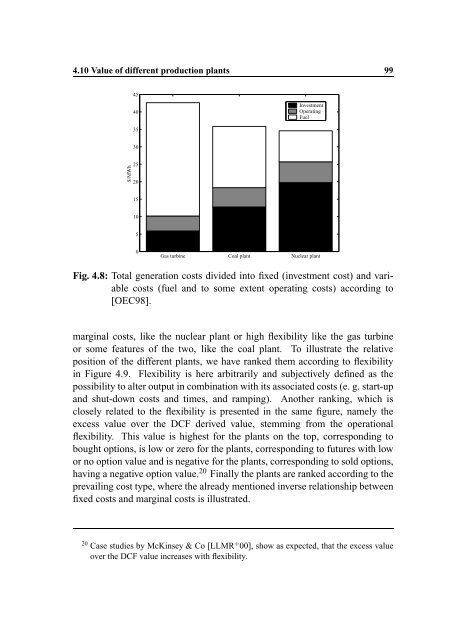
4.10 Value of different production plants 99<br />
45<br />
40<br />
Investment<br />
Operating<br />
Fuel<br />
35<br />
30<br />
$/MWh<br />
25<br />
20<br />
15<br />
10<br />
5<br />
0<br />
Gas turbine Coal plant Nuclear plant<br />
Fig. 4.8: Total generation costs divided into fixed (investment cost) <strong>and</strong> variable<br />
costs (fuel <strong>and</strong> to some extent operating costs) according to<br />
[OEC98].<br />
marginal costs, like the nuclear plant or high flexibility like the gas turbine<br />
or some features of the two, like the coal plant. To illustrate the relative<br />
position of the different plants, we have ranked them according to flexibility<br />
in Figure 4.9. Flexibility is here arbitrarily <strong>and</strong> subjectively defined as the<br />
possibility to alter output in combination with its associated costs (e. g. start-up<br />
<strong>and</strong> shut-down costs <strong>and</strong> times, <strong>and</strong> ramping). Another ranking, which is<br />
closely related to the flexibility is presented in the same figure, namely the<br />
excess value over the DCF derived value, stemming from the operational<br />
flexibility. This value is highest for the plants on the top, corresponding to<br />
bought options, is low or zero for the plants, corresponding to futures with low<br />
or no option value <strong>and</strong> is negative for the plants, corresponding to sold options,<br />
having a negative option value. 20 Finally the plants are ranked according to the<br />
prevailing cost type, where the already mentioned inverse relationship between<br />
fixed costs <strong>and</strong> marginal costs is illustrated.<br />
20 Case studies by McKinsey & Co [LLMR¼ 00], show as expected, that the excess value<br />
over the DCF value increases with flexibility.