Hedging Strategy and Electricity Contract Engineering - IFOR
Hedging Strategy and Electricity Contract Engineering - IFOR
Hedging Strategy and Electricity Contract Engineering - IFOR

You also want an ePaper? Increase the reach of your titles
YUMPU automatically turns print PDFs into web optimized ePapers that Google loves.
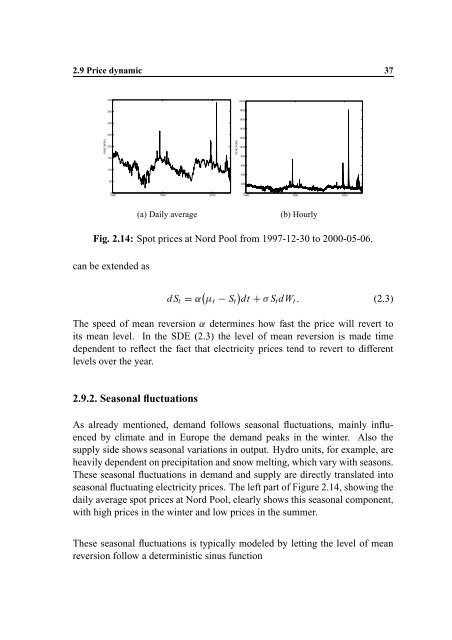
2.9 Price dynamic 37<br />
400<br />
2000<br />
350<br />
1800<br />
300<br />
1600<br />
1400<br />
NOK/MWh<br />
250<br />
200<br />
150<br />
NOK/MWh<br />
1200<br />
1000<br />
800<br />
100<br />
600<br />
400<br />
50<br />
200<br />
0<br />
1998 1999 2000<br />
0<br />
1998 1999 2000<br />
(a) Daily average<br />
(b) Hourly<br />
Fig. 2.14: Spot prices at Nord Pool from 1997-12-30 to 2000-05-06.<br />
can be extended as<br />
dS t R Q t S t dt F S t dW t<br />
P (2.3)<br />
The speed of mean R reversion determines how fast the price will revert to<br />
its mean level. In the SDE (2.3) the level of mean reversion is made time<br />
dependent to reflect the fact that electricity prices tend to revert to different<br />
levels over the year.<br />
2.9.2. Seasonal fluctuations<br />
As already mentioned, dem<strong>and</strong> follows seasonal fluctuations, mainly influenced<br />
by climate <strong>and</strong> in Europe the dem<strong>and</strong> peaks in the winter. Also the<br />
supply side shows seasonal variations in output. Hydro units, for example, are<br />
heavily dependent on precipitation <strong>and</strong> snow melting, which vary with seasons.<br />
These seasonal fluctuations in dem<strong>and</strong> <strong>and</strong> supply are directly translated into<br />
seasonal fluctuating electricity prices. The left part of Figure 2.14, showing the<br />
daily average spot prices at Nord Pool, clearly shows this seasonal component,<br />
with high prices in the winter <strong>and</strong> low prices in the summer.<br />
These seasonal fluctuations is typically modeled by letting the level of mean<br />
reversion follow a deterministic sinus function