Hedging Strategy and Electricity Contract Engineering - IFOR
Hedging Strategy and Electricity Contract Engineering - IFOR
Hedging Strategy and Electricity Contract Engineering - IFOR

Create successful ePaper yourself
Turn your PDF publications into a flip-book with our unique Google optimized e-Paper software.
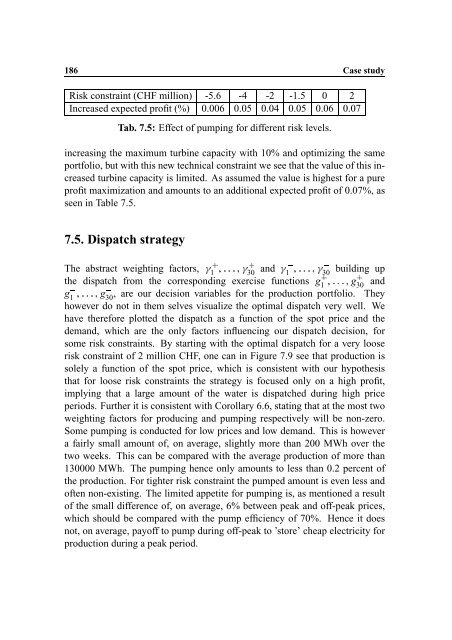
186 Case study<br />
Risk constraint (CHF million) -5.6 -4 -2 -1.5 0 2<br />
Increased expected profit (%) 0.006 0.05 0.04 0.05 0.06 0.07<br />
Tab. 7.5: Effect of pumping for different risk levels.<br />
increasing the maximum turbine capacity with 10% <strong>and</strong> optimizing the same<br />
portfolio, but with this new technical constraint we see that the value of this increased<br />
turbine capacity is limited. As assumed the value is highest for a pure<br />
profit maximization <strong>and</strong> amounts to an additional expected profit of 0.07%, as<br />
seen in Table 7.5.<br />
7.5. Dispatch strategy<br />
The abstract 9 weighting 6 88J8 6 9 factors, 41<br />
430 <strong>and</strong> 1 6 88J8 6 9 7<br />
30<br />
the dispatch from the corresponding exercise functions g41 6 9 6<br />
g430<br />
7<br />
8J88<br />
building up<br />
<strong>and</strong><br />
6 88J8 6<br />
g71<br />
g730<br />
, are our decision variables for the production portfolio. They<br />
however do not in them selves visualize the optimal dispatch very well. We<br />
have therefore plotted the dispatch as a function of the spot price <strong>and</strong> the<br />
dem<strong>and</strong>, which are the only factors influencing our dispatch decision, for<br />
some risk constraints. By starting with the optimal dispatch for a very loose<br />
risk constraint of 2 million CHF, one can in Figure 7.9 see that production is<br />
solely a function of the spot price, which is consistent with our hypothesis<br />
that for loose risk constraints the strategy is focused only on a high profit,<br />
implying that a large amount of the water is dispatched during high price<br />
periods. Further it is consistent with Corollary 6.6, stating that at the most two<br />
weighting factors for producing <strong>and</strong> pumping respectively will be non-zero.<br />
Some pumping is conducted for low prices <strong>and</strong> low dem<strong>and</strong>. This is however<br />
a fairly small amount of, on average, slightly more than 200 MWh over the<br />
two weeks. This can be compared with the average production of more than<br />
130000 MWh. The pumping hence only amounts to less than 0.2 percent of<br />
the production. For tighter risk constraint the pumped amount is even less <strong>and</strong><br />
often non-existing. The limited appetite for pumping is, as mentioned a result<br />
of the small difference of, on average, 6% between peak <strong>and</strong> off-peak prices,<br />
which should be compared with the pump efficiency of 70%. Hence it does<br />
not, on average, payoff to pump during off-peak to ’store’ cheap electricity for<br />
production during a peak period.