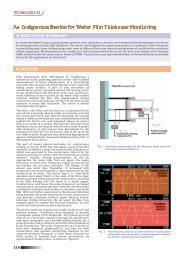
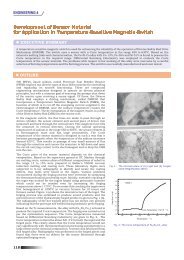
7 - Indira Gandhi Centre for Atomic Research
7 - Indira Gandhi Centre for Atomic Research
7 - Indira Gandhi Centre for Atomic Research

Create successful ePaper yourself
Turn your PDF publications into a flip-book with our unique Google optimized e-Paper software.
8. Interpretation: Includes interpreting the discovered patterns and possibly returning<br />
to any of the previous steps as well as possible visualization of the extracted<br />
patterns, removing redundant or irrelevant patterns and translating the useful ones<br />
into terms understandable by the users.<br />
9. Using the discovered Knowledge: Includes incorporating discovered knowledge<br />
into the per<strong>for</strong>mance system, taking action based on the knowledge or simply<br />
documenting it <strong>for</strong> management/later use.<br />
3. Knowledge Discovery Techniques<br />
The Knowledge discovery can be of two categories: descriptive knowledge discovery and<br />
predictive knowledge discovery. The <strong>for</strong>mer describes the data set in a concise and<br />
summary manner and presents general properties of the data; whereas the later constructs<br />
one or a set of models, per<strong>for</strong>ms inference on the available sets of data and attempts to<br />
predict the behavior of new data sets. The features of knowledge discovery includes<br />
• Large Amount of data<br />
• Efficiency<br />
• Accuracy<br />
• Automated Learning<br />
• High Level Language<br />
• Interesting Results<br />
3.1 Probabilistic Approach<br />
This method utilizes graphical representation models to compare different representations.<br />
Visualization tools are a class of advanced graphical presentation tools that facilitate data<br />
exploration, hypothesis development, testing and evaluation of new or existing theory of<br />
knowledge. Using appropriate computer technology, a skilled and well-motivated human<br />
user can directly visualize patterns connection, correlations or lack thereof, among<br />
parameters that have been measured or calculated. While this parameter can be codified in<br />
numbers, visualization brings the enormous power of human perception to bear in entirely<br />
new ways. One of the important uses of visualizing complex relationships among several<br />
variables could be to understand the nature of empirical data in order to select the<br />
appropriate techniques <strong>for</strong> further analysis.<br />
3.2 Statistical Approach<br />
The statistical approach uses rule discovery and is based on data relationships. An<br />
inductive learning algorithm can be used to generalize patterns in the data and to construct<br />
rules from the noted patterns. Online analytical processing (OLAP) is an example of a<br />
statistically oriented approach.<br />
3.3 Deviations and Trend Analysis<br />
Pattern detection by filtering important trends is the basic <strong>for</strong> this approach. This is<br />
normally applied to temporal databases, such as analysis of traffic on large<br />
telecommunication networks.<br />
143