Access to HIV Services for Mobile and Migrant Populations in Antigua
Access to HIV Services for Mobile and Migrant Populations in Antigua
Access to HIV Services for Mobile and Migrant Populations in Antigua

You also want an ePaper? Increase the reach of your titles
YUMPU automatically turns print PDFs into web optimized ePapers that Google loves.
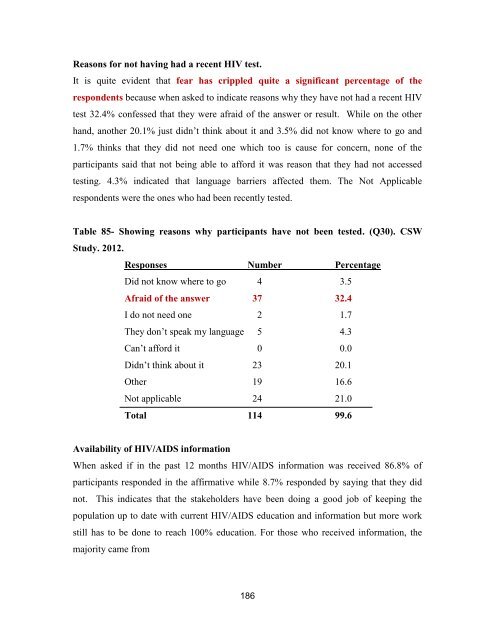
Reasons <strong>for</strong> not hav<strong>in</strong>g had a recent <strong>HIV</strong> test.<br />
It is quite evident that fear has crippled quite a significant percentage of the<br />
respondents because when asked <strong>to</strong> <strong>in</strong>dicate reasons why they have not had a recent <strong>HIV</strong><br />
test 32.4% confessed that they were afraid of the answer or result. While on the other<br />
h<strong>and</strong>, another 20.1% just didn’t th<strong>in</strong>k about it <strong>and</strong> 3.5% did not know where <strong>to</strong> go <strong>and</strong><br />
1.7% th<strong>in</strong>ks that they did not need one which <strong>to</strong>o is cause <strong>for</strong> concern, none of the<br />
participants said that not be<strong>in</strong>g able <strong>to</strong> af<strong>for</strong>d it was reason that they had not accessed<br />
test<strong>in</strong>g. 4.3% <strong>in</strong>dicated that language barriers affected them. The Not Applicable<br />
respondents were the ones who had been recently tested.<br />
Table 85- Show<strong>in</strong>g reasons why participants have not been tested. (Q30). CSW<br />
Study. 2012.<br />
Responses Number Percentage<br />
Did not know where <strong>to</strong> go 4 3.5<br />
Afraid of the answer 37 32.4<br />
I do not need one 2 1.7<br />
They don’t speak my language 5 4.3<br />
Can’t af<strong>for</strong>d it 0 0.0<br />
Didn’t th<strong>in</strong>k about it 23 20.1<br />
Other 19 16.6<br />
Not applicable 24 21.0<br />
Total 114 99.6<br />
Availability of <strong>HIV</strong>/AIDS <strong>in</strong><strong>for</strong>mation<br />
When asked if <strong>in</strong> the past 12 months <strong>HIV</strong>/AIDS <strong>in</strong><strong>for</strong>mation was received 86.8% of<br />
participants responded <strong>in</strong> the affirmative while 8.7% responded by say<strong>in</strong>g that they did<br />
not. This <strong>in</strong>dicates that the stakeholders have been do<strong>in</strong>g a good job of keep<strong>in</strong>g the<br />
population up <strong>to</strong> date with current <strong>HIV</strong>/AIDS education <strong>and</strong> <strong>in</strong><strong>for</strong>mation but more work<br />
still has <strong>to</strong> be done <strong>to</strong> reach 100% education. For those who received <strong>in</strong><strong>for</strong>mation, the<br />
majority came from<br />
186