02 MARKET AND INDUSTRY TRENDS BY TECHNOLOGY – CSP Solar Thermal Heating and Cooling ■■Solar Thermal Heating and Cooling Markets Solar thermal technologies contribute significantly to hot water production in many countries and increasingly to space heating and cooling as well as industrial processes. In 2011 i , the world added nearly 51 GW th (more than 72 million m 2 ) of solar heat capacity, for a year-end total of 247 GW th . 1 An estimated 49 GW th (>96%) of the market was glazed water systems and the rest was unglazed water systems for swimming pool heating, as well as unglazed and glazed air collector systems. 2 The vast majority of solar heat capacity (all types) is in China and Europe, together accounting for more than 90% of the world market and 81% of total capacity in 2011. 3 The top countries for total capacity in operation were China, the United States, Germany, Turkey, and Brazil. 4 China focuses on evacuated tube (glazed) water collectors, whereas most systems in the United States use unglazed water collectors for pool heating. The only other markets of note for unglazed water collectors are Australia and, to a lesser extent, Brazil; other key markets rely primarily on flat plate (glazed) water collector technology. 5 Counting glazed water systems only ii , the market grew 15%, and total global capacity in operation by the end of 2011 (223 GW th ) provided an estimated 193 TWh (696 PJ) of heat annually. 6 The 2011 market leaders for newly installed glazed water collector capacity were China, Turkey, Germany, India, and Brazil; the same countries led for total capacity, with Brazil ahead of India. 7 (See Figures 15 and 16 and Reference Table R7.) By the end of 2012, global solar thermal capacity in operation reached an estimated 282 GW th . 8 Global capacity of glazed water collectors reached 255 GW th . 9 (See Figure 17.) China was again the main driver of solar thermal demand, adding 44.7 GW th , a market increase of 11% over 2011. Total capacity rose 18.6% (net 28.3 GW th ), to 180.4 GW th —amounting to about two-thirds of global capacity. 10 In China, solar heaters cost far less over their lifetimes than do electric or gas heaters, a major factor driving the market. 11 Even so, deceleration in the building sector and some saturation of rural areas has slowed growth since 2009. 12 Most demand in China is for residential purposes. A growing share of systems is being installed on large apartment buildings in response to local government mandates. 13 Solar thermal systems incorporated into building walls and balconies also make up a growing portion of China’s market; simple rooftop installations account for about 60% of the market, and falling. 14 The European Union accounted for most of the remaining added capacity, although growth continued to be constrained by lower rates of building renovation, due in large part to the economic crisis, and to the reduction of support policies for solar heating. 15 Germany and Austria, the long-term EU leaders for total installations, have both experienced marked declines. 16 Germany remained Europe’s largest installer in 2012, adding 805 MW th for a total of 11.4 GW th ; but this was down from 889 MW th in 2011, explained partially by a reduction in incentives as of January 2012. 17 The Austrian market shrank 10.3% in 2012, following a 17.8% decline in 2011, due largely to the greater appeal of solar PV for investors. 18 The Greek market has been trending upwards despite economic turmoil, increasing 7.5% in 2011 and 5.7% in 2012, due to rising electricity and heating oil prices. 19 While the European market is becoming more diversified, growth in developing markets, such as Denmark and Poland, did not make up for the decrease in the region’s larger markets in 2012. 20 Turkey had almost 10.2 GW th of glazed water collectors in operation at the end of 2011. 21 Markets remained strong without government incentives and despite an expanding natural gas network due largely to a high level of public awareness about the technology. 22 In addition to hotels and hospitals, the lowincome housing sector is an important market in Turkey, and multi-family structures are considered to be the fastest growing market segment. 23 Japan and India are the largest Asian markets outside of China. India added more than 0.6 GW th during the fiscal year 2011–12 for a total of 4.8 GW th in early <strong>2013</strong>. 24 Japan’s market experienced limited growth during 2011 and 2012, but is still below 2008 levels, and South Korea has seen installations slow in recent years. 25 But Thailand’s market is growing in response to an incentive for new hybrid (solar-waste heat) systems, with the capacity of subsidised systems increasing 13% in 2012. 26 Brazil added almost 0.6 GW th to end 2012 with about 5.7 GW th (including unglazed water collectors). 27 The Brazilian market has expanded rapidly due in part to programmes such as Minha Casa Minha Vida (“My House, My Life”), which mandates solar thermal on low-income housing. 28 Mexico is also starting to play a role, and there are very small but growing markets in Argentina, Chile, and Uruguay. 29 To the north, the United States accounted for almost two-thirds of all unglazed water collectors in operation. 30 The U.S. market for glazed water collectors is relatively small, however, and new installations declined in 2011 relative to 2010. 31 At least in California, low natural gas prices and lack of awareness have made it difficult to sell systems in the residential market. 32 As with solar PV, however, third-party ownership represents a growing trend, and some states have set solar thermal carveouts in their renewable portfolio standards. 33 Several countries in Africa use solar thermal, including Egypt, Mozambique, Tunisia, Zimbabwe, and South Africa, the most mature market in sub-Saharan Africa. 34 Tunisia’s PROSOL programme increased annual installations more than 13-fold over five years, to more than 64 MW th . 35 In the Middle East, Israel leads for capacity installed, followed by Jordan and Lebanon, where penetration is 13% in the residential sector and the market is driven by national subsidies, zero-interest loans, and municipal mandates. 36 Although it ranked 22nd overall for capacity of glazed water systems at the end of 2011, Cyprus remained the world leader i The year 2011 is the most recent one for which firm global data and most country statistics are available. ii Most countries collect data for glazed water collectors only, although the most important markets for unglazed water collectors also track this collector type; air collector capacities are more uncertain, but play a minor role in the market overall. To avoid mixing countries that have detailed data across all collectors with those that do not, the GSR focuses primarily on glazed water collectors. 46
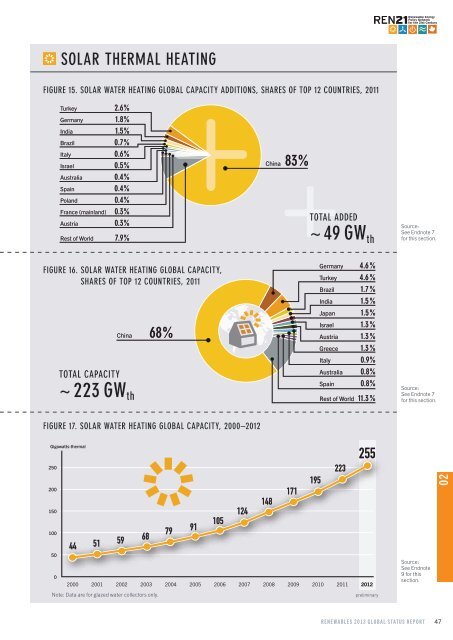
SOLAR THERMAL HEATING Figure 15. Solar Water Heating Global Capacity Additions, Shares of Top 12 Countries, 2011 Turkey 2.6% Germany 1.8% India 1.5% Brazil 0.7% Italy 0.6% Israel 0.5% Australia 0.4% Spain 0.4% Poland 0.4% France (mainland) 0.3% Austria 0.3% Rest of World 7.9% China 83% Total Added ~49 GW th Source: See Endnote 7 for this section. Figure 16. Solar Water Heating Global Capacity, Shares of Top 12 Countries, 2011 Total CAPACITY ~223 GW th China 68% Germany 4.6% Turkey 4.6% Brazil 1.7% India 1.5% Japan 1.5% Israel 1.3% Austria 1.3% Greece 1.3% Italy 0.9% Australia 0.8% Spain 0.8% Rest of World 11.3% Source: See Endnote 7 for this section. Figure 17. Solar Water Heating Global Capacity, 2000–2012 Gigawatts-thermal 250 200 150 100 44 223 195 171 148 124 105 79 91 59 68 51 255 50 0 2000 2001 2002 2003 2004 2005 2006 2007 2008 2009 2010 2011 2012 Note: Data are for glazed water collectors only. preliminary Source: See Endnote 9 for this section. 02 Renewables <strong>2013</strong> Global Status Report 47
- Page 1 and 2: RenewableS 2013 GLOBAL STATUS REPOR
- Page 3 and 4: FOREWORD Access to modern energy en
- Page 5 and 6: TABLES TABLE 1 Estimated Direct and
- Page 7 and 8: REN21 Flagship Products and Activit
- Page 9 and 10: ■■Lead Regional and Country Res
- Page 11 and 12: ■■Reviewers and other Contribut
- Page 13 and 14: EXECUTIVE SUMMARY Renewable energy
- Page 15 and 16: In response to rapidly changing mar
- Page 17 and 18: TOP FIVE COUNTRIES ANNUAL INVESTMEN
- Page 19 and 20: 01 GLOBAL MARKET AND INDUSTRY OVERV
- Page 21 and 22: ■■Power Sector Total renewable
- Page 23 and 24: Sidebar 1. The REN21 Renewables Glo
- Page 25 and 26: ■■Heating and Cooling Sector Mo
- Page 27 and 28: 02 MARKET AND INDUSTRY TRENDS BY TE
- Page 29 and 30: ecame a net importer of ethanol (ma
- Page 31 and 32: data. About 230 co-firing plants we
- Page 33 and 34: ■■Liquid Biofuels Industry The
- Page 35 and 36: ■■Geothermal Industry A large n
- Page 37 and 38: Sidebar 3. Sustainability Spotlight
- Page 39 and 40: Ocean Energy ■■Ocean Energy Mar
- Page 41 and 42: SOLAR PHOTOVOLTAICS (PV) Figure 11.
- Page 43 and 44: plant that started operating in 201
- Page 45: Figure 14. Concentrating Solar Ther
- Page 49 and 50: Wind Power ■■Wind Power Markets
- Page 51 and 52: Pacific to add capacity (0.4 GW), b
- Page 53 and 54: Sidebar 4. Jobs in Renewable Energy
- Page 55 and 56: TABLE 2. Status of Renewable Energy
- Page 57 and 58: 03 INVESTMENT FLOWS Global new inve
- Page 59 and 60: Germany invested more than any othe
- Page 61 and 62: ■■Investment by Technology In 2
- Page 63 and 64: ■■Renewable Energy Investment i
- Page 65 and 66: 04 POLICY LANDSCAPE The number of p
- Page 67 and 68: announced its target to develop 1 G
- Page 69 and 70: In Europe, two existing RPS policie
- Page 71 and 72: Sidebar 7. Linking Renewable Energy
- Page 73 and 74: government targets called for an es
- Page 75 and 76: establishments, including hospitals
- Page 77 and 78: Table 3. Renewable Energy Support P
- Page 79 and 80: Policy MAPS FIGURE 25. COUNTRIES WI
- Page 81 and 82: 05 RURAL RENEWABLE ENERGY Access to
- Page 83 and 84: Solid biomass applications for dryi
- Page 85 and 86: presents significant gaps among cou
- Page 87 and 88: micro turbines were added to provid
- Page 89 and 90: 06 FEATURE: SYSTEM TRANSFORMATION B
- Page 91 and 92: ■■The Economic Challenge Conven
- Page 93 and 94: REFERENCE TABLES TABLE R1. GLOBAL R
- Page 95 and 96: Table R3. WOOD PELLET GLOBAL TRADE,
- Page 97 and 98:
TABLE R5. SOLAR PV GLOBAL CAPACITY
- Page 99 and 100:
TABLE R7. SOLAR WATER HEATING GLOBA
- Page 101 and 102:
TABLE R9. GLOBAL TRENDS IN RENEWABL
- Page 103 and 104:
TABLE R10. SHARE OF PRIMARY AND FIN
- Page 105 and 106:
TABLE R10. SHARE OF PRIMARY AND FIN
- Page 107 and 108:
TABLE R11 ANNEX. SHARE OF ELECTRICI
- Page 109 and 110:
TABLE R12. OTHER RENEWABLE ENERGY T
- Page 111 and 112:
TABLE R12. OTHER RENEWABLE ENERGY T
- Page 113 and 114:
TABLE R12. OTHER RENEWABLE ENERGY T
- Page 115 and 116:
TABLE R12. OTHER RENEWABLE ENERGY T
- Page 117 and 118:
TABLE R14. CUMULATIVE NUMBER OF COU
- Page 119 and 120:
TABLE R16. CITY AND LOCAL RENEWABLE
- Page 121 and 122:
TABLE R16. CITY AND LOCAL RENEWABLE
- Page 123 and 124:
TABLE R17. ELECTRICITY ACCESS BY RE
- Page 125 and 126:
TABLE R18. POPULATION RELYING ON TR
- Page 127 and 128:
Council i , have shifted to trackin
- Page 129 and 130:
solar beam that heats a working flu
- Page 131 and 132:
Renewable portfolio standard (RPS)
- Page 133 and 134:
LIST OF ABBREVIATIONS BIPV BNEF BOS
- Page 135 and 136:
- Solar, 4 March 2013; MERCOM Capit
- Page 137 and 138:
from MNRE, “Achievements,” op.
- Page 139 and 140:
68 Dong Energy, “Green Heat to th
- Page 141 and 142:
are preliminary and are based on P.
- Page 143 and 144:
made, this has not yet become evide
- Page 145 and 146:
Hydropower 1 International Hydropow
- Page 147 and 148:
47 IMPSA, “Corporate Presentation
- Page 149 and 150:
op. cit. note 1, p. 13. Below expec
- Page 151 and 152:
66 Based on production capacity of
- Page 153 and 154:
7 Technology dominates from Proterm
- Page 155 and 156:
4 Ibid., p. 2. 5 Franz Mauthner, AE
- Page 157 and 158:
48 Daniel Rowe, Commonwealth Scient
- Page 159 and 160:
of 1,905 MW; and Poland added 880 M
- Page 161 and 162:
Global Wind Turbine OEM Market Lead
- Page 163 and 164:
capacity factors range from around
- Page 165 and 166:
Policy Landscape 1 This section is
- Page 167 and 168:
Launches Massive Renewable Program
- Page 169 and 170:
on Dec. 1,” biofuelsdigest.com, 2
- Page 171 and 172:
RURAL RENEWABLE ENERGY 1 Internatio
- Page 173 and 174:
Feature: SYSTEM TRANSFORMATION 1 Se
- Page 175 and 176:
Power: 2012 European Statistics (Br
- Page 177 and 178:
177