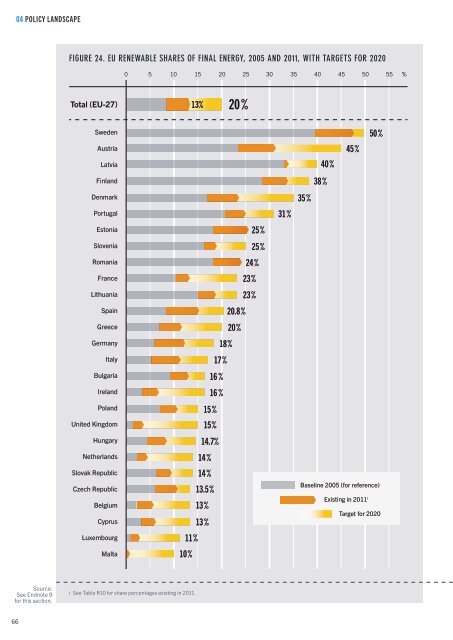
04 POLICY LANDSCAPE Figure 24. EU Renewable Shares of Final Energy, 2005 and 2011, with Targets for 2020 0 5 10 15 20 25 30 35 40 45 50 55 % Total (EU-27) 13% 20% Sweden Austria Latvia Finland Denmark Portugal Estonia Slovenia Romania France Lithuania Spain Greece Germany Italy Bulgaria Ireland Poland United Kingdom Hungary Netherlands Slovak Republic Czech Republic Belgium Cyprus Luxembourg Malta 25% 25% 24% 23% 23% 20.8% 20% 18% 17% 16 % 16 % 15% 15% 14.7% 14% 14% 13.5% 13% 13% 11% 10% 31% 50% 45% 40% 38% 35% Baseline 2005 (for reference) Existing in 2011 i Target for 2020 Source: See Endnote 9 for this section. i See Table R10 for share percentages existing in 2011. 66
announced its target to develop 1 GW of offshore wind capacity by 2020; the Russian Federation mandated the release of technology-specific targets to meet its 2020 renewable electricity target of 4.5%; and Scotland raised its near-term renewable electricity target from 31% to 50% by 2015. 11 In Asia, the Chinese 12th Five-Year Plan for Renewable Energy set 2015 targets for 9.5% of primary energy consumption to come from renewables and for a total of 280 GW th (400 million m 2 ) of solar heating capacity. 12 Under the Phase II plan for the National Solar Mission, India extended its expiring solar water heating target (4.9 GW th , or 7 million m 2 ) to 5.6 GW th (8 million m 2 ) of new capacity to be added between 2012 and 2017; and Japan announced a target to develop 1,500 MW of new wave and tidal capacity by 2030. 13 Kazakhstan seeks to develop 1.04 GW of renewable capacity by 2020. 14 The Middle East and North Africa (MENA) region saw significant new developments in 2012 as the Egyptian Solar Plan, approved in July 2012, set a target for 2,800 MW of concentrating solar thermal power (CSP) and 700 MW of solar PV by 2027; Jordan adopted a target for 1,000 MW of renewable capacity by 2018; and Libya set targets for the share of renewable energy in the national generation mix at 3% by 2015, 7% by 2020, and 10% by 2025. 15 Elsewhere in Africa, Djibouti, which had no renewable power capacity as of 2009, has committed to a goal of 100% renewables by 2020; and the Kingdom of Lesotho set a target of 260 MW of renewable power capacity by 2030. 16 Several countries and one Canadian province strengthened existing targets in 2012. (See Reference Tables R10–R12 in this report and Reference Tables R9–R11 in GSR 2012.) In addition to setting new targets, China increased existing targets, Sidebar 6. Current Status of Global Energy Subsidies According to the International Energy Agency (IEA), worldwide subsidies i for fossil fuel consumption amounted to an estimated USD 523 billion in 2011, an increase of 27% over 2010—reflecting rising energy prices and increased consumption of subsidised fuels. The International Monetary Fund (IMF) estimates that on a “post-tax basis,” which also factors in the negative externalities from energy consumption, total subsidies ii for petroleum products, electricity, natural gas, and coal are much higher, at USD 1.9 trillion (2.5% of global GDP or 8% of total government revenues). Dr. Fatih Birol, the chief economist at the IEA, has called fossil fuel subsidies “public enemy number one to sustainable energy development.” Subsidies and financial support for renewable energy (excluding large hydropower) in 2011 totalled USD 88 billion, up 24% over 2010 but still only around one-sixth of fossil fuel subsidies. About 73% went to the electricity sector (mostly to support solar PV), and most of the rest went to biofuels, with very little used to support renewable heating or cooling. The European Union accounted for nearly 57% of these subsidies, and the United States for 24%. Well-designed subsidies for renewable energy can result in long-term economic and environmental benefits, including improved health, employment opportunities, and energy access and security. Conversely, the costs of subsidies directed at fossil fuels generally outweigh the benefits. Fossil fuel subsidies in energy-importing countries usually impose a heavy burden on national budgets, and in fossil fuel-exporting countries they can accelerate the depletion of resources due to wasteful consumption, thereby reducing future export earnings over the long term. In 2009, leaders of the G20 countries pledged to end fossil fuel subsidies, committing to “rationalize and phase out over the medium term inefficient fossil fuel subsidies that encourage wasteful consumption.” They acknowledged that fossil fuel subsidies distort markets, hamper investment in clean energy sources, and undermine efforts to mitigate the climate crisis. This step led to the establishment of a broader international coalition that includes Asia-Pacific Economic Cooperation (APEC) countries as well as many additional countries in which high energy prices have made subsidies financially unsustainable. At the G20 Finance Ministers Meeting in February <strong>2013</strong>, leaders again committed to report on progress to rationalise and phase out fossil fuel subsidies, and to provide targeted support for the poorest people. Very little other international action has followed, with the exception of two reports on the scope of energy subsidies and suggestions for the implementation of their phaseout, published jointly by the IEA, OPEC, OECD, and World Bank. In addition, the IMF published a report in early <strong>2013</strong> urging policymakers to reform subsidies for fossil fuel products, arguing that this could translate into major gains for both economic growth and the environment. The practical effect on a global basis has been minimal to date due to the lack of a timeline and an organisation to monitor and aid countries wanting to implement their commitments. A small number of countries have taken steps towards energy subsidy reform, and others—including fossil fuel-exporting non-OECD countries like Iran, Indonesia, Nigeria, and the Sudan—have begun to reduce subsidies. Further, since the G20 meeting in 2009, an increasing number of civil society observers has begun to track the issue of fossil fuel subsidies. At the same time, however, several OECD countries have begun to reduce subsidies for renewable energy sources, due largely to individual domestic political and economic circumstances, lower technology prices, and a lack of long-term policy guidance for renewables. Source: See Endnote 2 for this section. 04 i The IEA defines subsidies as government measures that artificially reduce production costs or the price that consumers pay for energy, per IEA, “How Big Are Energy Subsidies and Which Fuels Benefit?” WEO 2011 Factsheet (Paris: 2011). ii The IMF defines consumer subsidies as the difference between a benchmark price and the price paid by energy consumers (including both households for final consumption and enterprises for intermediate consumption) and producer subsidies as the difference between a benchmark price and prices received by the supplier; the benchmark price for internationally traded energy products is the international price adjusted for distribution and transportation costs. The IMF estimate does not include all producer subsidies due to lack of data. 67
- Page 1 and 2:
RenewableS 2013 GLOBAL STATUS REPOR
- Page 3 and 4:
FOREWORD Access to modern energy en
- Page 5 and 6:
TABLES TABLE 1 Estimated Direct and
- Page 7 and 8:
REN21 Flagship Products and Activit
- Page 9 and 10:
■■Lead Regional and Country Res
- Page 11 and 12:
■■Reviewers and other Contribut
- Page 13 and 14:
EXECUTIVE SUMMARY Renewable energy
- Page 15 and 16: In response to rapidly changing mar
- Page 17 and 18: TOP FIVE COUNTRIES ANNUAL INVESTMEN
- Page 19 and 20: 01 GLOBAL MARKET AND INDUSTRY OVERV
- Page 21 and 22: ■■Power Sector Total renewable
- Page 23 and 24: Sidebar 1. The REN21 Renewables Glo
- Page 25 and 26: ■■Heating and Cooling Sector Mo
- Page 27 and 28: 02 MARKET AND INDUSTRY TRENDS BY TE
- Page 29 and 30: ecame a net importer of ethanol (ma
- Page 31 and 32: data. About 230 co-firing plants we
- Page 33 and 34: ■■Liquid Biofuels Industry The
- Page 35 and 36: ■■Geothermal Industry A large n
- Page 37 and 38: Sidebar 3. Sustainability Spotlight
- Page 39 and 40: Ocean Energy ■■Ocean Energy Mar
- Page 41 and 42: SOLAR PHOTOVOLTAICS (PV) Figure 11.
- Page 43 and 44: plant that started operating in 201
- Page 45 and 46: Figure 14. Concentrating Solar Ther
- Page 47 and 48: SOLAR THERMAL HEATING Figure 15. So
- Page 49 and 50: Wind Power ■■Wind Power Markets
- Page 51 and 52: Pacific to add capacity (0.4 GW), b
- Page 53 and 54: Sidebar 4. Jobs in Renewable Energy
- Page 55 and 56: TABLE 2. Status of Renewable Energy
- Page 57 and 58: 03 INVESTMENT FLOWS Global new inve
- Page 59 and 60: Germany invested more than any othe
- Page 61 and 62: ■■Investment by Technology In 2
- Page 63 and 64: ■■Renewable Energy Investment i
- Page 65: 04 POLICY LANDSCAPE The number of p
- Page 69 and 70: In Europe, two existing RPS policie
- Page 71 and 72: Sidebar 7. Linking Renewable Energy
- Page 73 and 74: government targets called for an es
- Page 75 and 76: establishments, including hospitals
- Page 77 and 78: Table 3. Renewable Energy Support P
- Page 79 and 80: Policy MAPS FIGURE 25. COUNTRIES WI
- Page 81 and 82: 05 RURAL RENEWABLE ENERGY Access to
- Page 83 and 84: Solid biomass applications for dryi
- Page 85 and 86: presents significant gaps among cou
- Page 87 and 88: micro turbines were added to provid
- Page 89 and 90: 06 FEATURE: SYSTEM TRANSFORMATION B
- Page 91 and 92: ■■The Economic Challenge Conven
- Page 93 and 94: REFERENCE TABLES TABLE R1. GLOBAL R
- Page 95 and 96: Table R3. WOOD PELLET GLOBAL TRADE,
- Page 97 and 98: TABLE R5. SOLAR PV GLOBAL CAPACITY
- Page 99 and 100: TABLE R7. SOLAR WATER HEATING GLOBA
- Page 101 and 102: TABLE R9. GLOBAL TRENDS IN RENEWABL
- Page 103 and 104: TABLE R10. SHARE OF PRIMARY AND FIN
- Page 105 and 106: TABLE R10. SHARE OF PRIMARY AND FIN
- Page 107 and 108: TABLE R11 ANNEX. SHARE OF ELECTRICI
- Page 109 and 110: TABLE R12. OTHER RENEWABLE ENERGY T
- Page 111 and 112: TABLE R12. OTHER RENEWABLE ENERGY T
- Page 113 and 114: TABLE R12. OTHER RENEWABLE ENERGY T
- Page 115 and 116: TABLE R12. OTHER RENEWABLE ENERGY T
- Page 117 and 118:
TABLE R14. CUMULATIVE NUMBER OF COU
- Page 119 and 120:
TABLE R16. CITY AND LOCAL RENEWABLE
- Page 121 and 122:
TABLE R16. CITY AND LOCAL RENEWABLE
- Page 123 and 124:
TABLE R17. ELECTRICITY ACCESS BY RE
- Page 125 and 126:
TABLE R18. POPULATION RELYING ON TR
- Page 127 and 128:
Council i , have shifted to trackin
- Page 129 and 130:
solar beam that heats a working flu
- Page 131 and 132:
Renewable portfolio standard (RPS)
- Page 133 and 134:
LIST OF ABBREVIATIONS BIPV BNEF BOS
- Page 135 and 136:
- Solar, 4 March 2013; MERCOM Capit
- Page 137 and 138:
from MNRE, “Achievements,” op.
- Page 139 and 140:
68 Dong Energy, “Green Heat to th
- Page 141 and 142:
are preliminary and are based on P.
- Page 143 and 144:
made, this has not yet become evide
- Page 145 and 146:
Hydropower 1 International Hydropow
- Page 147 and 148:
47 IMPSA, “Corporate Presentation
- Page 149 and 150:
op. cit. note 1, p. 13. Below expec
- Page 151 and 152:
66 Based on production capacity of
- Page 153 and 154:
7 Technology dominates from Proterm
- Page 155 and 156:
4 Ibid., p. 2. 5 Franz Mauthner, AE
- Page 157 and 158:
48 Daniel Rowe, Commonwealth Scient
- Page 159 and 160:
of 1,905 MW; and Poland added 880 M
- Page 161 and 162:
Global Wind Turbine OEM Market Lead
- Page 163 and 164:
capacity factors range from around
- Page 165 and 166:
Policy Landscape 1 This section is
- Page 167 and 168:
Launches Massive Renewable Program
- Page 169 and 170:
on Dec. 1,” biofuelsdigest.com, 2
- Page 171 and 172:
RURAL RENEWABLE ENERGY 1 Internatio
- Page 173 and 174:
Feature: SYSTEM TRANSFORMATION 1 Se
- Page 175 and 176:
Power: 2012 European Statistics (Br
- Page 177 and 178:
177