- Page 1:
THE NEW ST. PETERSBURG PIER BASIS O
- Page 5 and 6:
CONTENT: BASIS OF DESIGN BOOK 1 1 2
- Page 7:
AST. PETERSBURG PIER SITE CONDITION
- Page 10 and 11:
2. Parking Lots Parking lots exhibi
- Page 12 and 13:
4. Entrance Plaza The Entrance Plaz
- Page 14 and 15:
Electrical: There is a series of ab
- Page 16 and 17:
B. Bulkhead The bulkhead or seawall
- Page 18 and 19:
C. Existing Pier The existing Pier
- Page 20 and 21:
5. Navigational Access The current
- Page 22 and 23:
Meeting with City Engineers 6/28 A
- Page 55 and 56:
Meeting Minutes (Rev 01) project Th
- Page 57:
CCONCEPTUAL FIRE SAFETY STRATEGY PR
- Page 60 and 61:
6.0 RB initially expressed concern
- Page 63 and 64:
idge, highway & rail engineering en
- Page 65:
St. Petersburg Pier Page 3 MEG File
- Page 69 and 70:
1509 W. Swann Avenue, Suite 225 Tam
- Page 71 and 72:
ERP Permit Application: New St. Pet
- Page 73 and 74:
ERP Permit Application: New St. Pet
- Page 75 and 76:
ERP Permit Application: New St. Pet
- Page 77 and 78:
ERP Permit Application: New St. Pet
- Page 79 and 80:
PART 3: A. Owner(s) of Land B. Appl
- Page 81 and 82:
PART 8: A. If there have been any p
- Page 83 and 84:
ENVIRONMENTAL RESOURCE PERMIT APPLI
- Page 85 and 86:
5. Summarize impacts to wetlands an
- Page 87 and 88:
E. Drainage Information 1. Provide
- Page 89 and 90:
TABLE ONE: PROJECT WETLAND AND OTHE
- Page 91 and 92:
TABLE THREE: PROJECT OFF-SITE MITIG
- Page 93 and 94:
TABLE FIVE: SUMMARY OF SHORELINE ST
- Page 96:
ERP Permit Application: New St. Pet
- Page 101 and 102:
ERP Permit Application: New St. Pet
- Page 103 and 104:
Soil Map-Pinellas County, Florida (
- Page 105 and 106:
ERP Permit Application: New St. Pet
- Page 120 and 121:
25 18 ALBERT WHITTED AIRPORT 36
- Page 122:
ALBERT WHITTED AIRPORT 36
- Page 147 and 148:
TECHNICAL M E M O R A N D U M TO: F
- Page 149 and 150:
St. Petersburg Pier - Environmental
- Page 151 and 152:
St. Petersburg Pier - Environmental
- Page 153 and 154:
G:\x\PROJECTS\002037_StPetePierEval
- Page 155 and 156:
ALBERT WHITTED AIRPORT TECHNICAL ME
- Page 157 and 158:
ALBERT WHITTED AIRPORT TECHNICAL ME
- Page 159 and 160:
ALBERT WHITTED AIRPORT TECHNICAL ME
- Page 161 and 162:
ALBERT WHITTED AIRPORT TECHNICAL ME
- Page 163:
ERP Permit Application: New St. Pet
- Page 175:
ERP Permit Application: New St. Pet
- Page 213 and 214: Underwater Feature Technical Worksh
- Page 215 and 216: 6. Limestone definitely preferred f
- Page 217 and 218: Participant List Participant Peter
- Page 219 and 220: Dr. Betzer mentioned the names of s
- Page 221 and 222: Technical Interview 5 Summary of In
- Page 223 and 224: scientific community and the design
- Page 225: GHYDRODYNAMICS AND FLUSHING OF THE
- Page 228 and 229: TABLE OF CONTENTS 1.0 INTRODUCTION
- Page 230 and 231: LIST OF FIGURES 2-1 Location of St.
- Page 232 and 233: 1.0 INTRODUCTION The City of St. Pe
- Page 234 and 235: loop structure. For the flushing ev
- Page 236 and 237: Figure 2-3b. Marina Construction De
- Page 238 and 239: Figure 2-4. Locations of NOAA Tide
- Page 240 and 241: 3.0 MODELING APPROACH Based upon th
- Page 242 and 243: 4.0 MODEL INPUTS 4.1 SIMULATION PER
- Page 244 and 245: Figure 4-2. Tampa Bay Model Grid in
- Page 246 and 247: Figure 4-4. Tampa Bay Model Grid in
- Page 248 and 249: Figure 4-5. Model Tidal forcing Fig
- Page 250 and 251: 5.0 MODEL CALIBRATION 5.1 TIDES Fig
- Page 252 and 253: Available current data for the NOAA
- Page 254 and 255: 6.0 EVALUATION OF FLUSHING IN MARIN
- Page 256 and 257: Figure 6-1c. Plan View Showing Flus
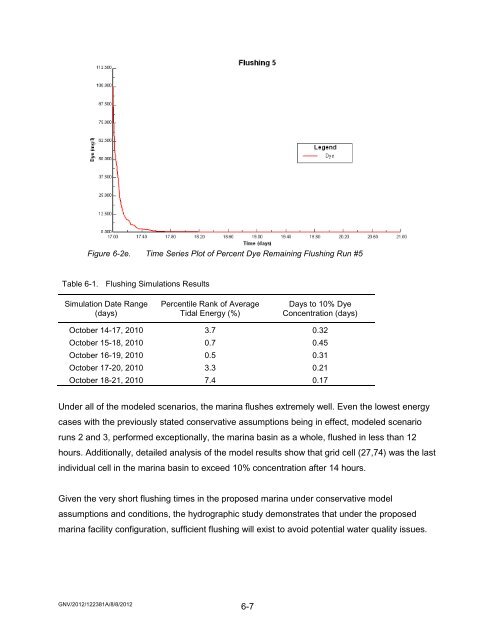
- Page 258 and 259: Figures 6-2a-e present time series
- Page 263: HPIER ADVISORY TASK FORCE REPORT
- Page 311 and 312:
Vision/Guiding Principles and Conte
- Page 313 and 314:
Table of Contents (continued) SECTI
- Page 315 and 316:
VISION The downtown waterfront is a
- Page 317 and 318:
Guiding Principles (continued): Wa
- Page 319 and 320:
Section II City Charter
- Page 321 and 322:
Waterfront Park Element Downtown Ch
- Page 323 and 324:
Evolution of the Current Waterfront
- Page 325 and 326:
Planning Goals Five major planning
- Page 327 and 328:
9. Comfort: a. Shade - Planting of
- Page 329 and 330:
1988 Plan Implementation in the Wat
- Page 331 and 332:
Art & Monuments Ordinance No. 2001-
- Page 333 and 334:
Section V Downtown Waterfront Enter
- Page 335 and 336:
Albert Whitted Airport ● ● ●
- Page 337 and 338:
Al Lang Field (continued) ● ● O
- Page 339 and 340:
Section VI Waterfront Transportatio
- Page 341 and 342:
Traffic Access and Circulation ●
- Page 343 and 344:
Bicycle Pedestrian Pathway ● ●
- Page 345 and 346:
Daily Parking Demand ● ● ●
- Page 347 and 348:
Downtown Waterfront Events ● ●
- Page 349:
DOWNTOWN WATERFRONT MASTER PLAN IMP
- Page 353 and 354:
Chuck Jablon Project Executive, Acc
- Page 355 and 356:
OT Delancy Executive Support - SBE/
- Page 357 and 358:
Mark McLaughlin, LEED® AP Senior P
- Page 359 and 360:
Meoi Plummer Project Manager - Crow
- Page 361 and 362:
Tommy Ward Superintendent/Quality C
- Page 363 and 364:
Jake Krehbiel, LEED® AP Assistant
- Page 365 and 366:
Walter Benoit Project Controls Pers
- Page 367 and 368:
Mark Apaliski Preconstruction Perso
- Page 369 and 370:
Robert Ward Local SBE/WMBE Personal
- Page 371:
K ASCE 24-05: FLOOD RESISTANT DESIG
- Page 374 and 375:
. Specifications are provided for p
- Page 376 and 377:
See next page for description of Ca
- Page 379:
L CITY PIER BUILDING FOUNDATION EVA
- Page 383 and 384:
Memorandum March 1, 2010 Page 2 of
- Page 385 and 386:
Memorandum March 1, 2010 Page 4 of
- Page 387:
Memorandum March 1, 2010 Page 6 of
- Page 391 and 392:
ESTIMATE DETAIL The Lens Estimate T
- Page 393 and 394:
Index Description Quantity Unit Cos
- Page 395 and 396:
Index Description Quantity Unit Cos
- Page 397 and 398:
Index Description Quantity Unit Cos
- Page 399 and 400:
Index Description Quantity Unit Cos
- Page 401 and 402:
Index Description Quantity Unit Cos
- Page 403 and 404:
Index Description Quantity Unit Cos
- Page 405 and 406:
Index Description Quantity Unit Cos
- Page 407 and 408:
Index Description Quantity Unit Cos
- Page 409 and 410:
Index Description Quantity Unit Cos
- Page 411 and 412:
Index Description Quantity Unit Cos
- Page 413:
Index Description Quantity Unit Cos
- Page 417:
The New St. Petersburg Pier Life Cy
- Page 421:
The New St. Petersburg Pier Revenue
- Page 425:
The New St. Petersburg Pier Annual
- Page 429:
OST. PETERSBURG PIER REQUEST FOR QU
- Page 432 and 433:
Pier Competition | Page 1 STAGE 1 P
- Page 434 and 435:
Pier Competition | Page 3 Vision IV
- Page 436 and 437:
Pier Competition | Page 5 The Trans
- Page 438 and 439:
Pier Competition | Page 7 VI. Compe
- Page 440 and 441:
Pier Competition | Page 9 Relevant
- Page 442 and 443:
Pier Competition | Page 11 The foll
- Page 444 and 445:
Pier Competition | Page 13 Team Bac
- Page 446 and 447:
Pier Competition | Page 15 Exhibit
- Page 448 and 449:
Pier Competition | Page 17 Exhibit
- Page 450 and 451:
Pier Competition | Page 19 8. Debar
- Page 452 and 453:
Pier Competition | Page 21 Disputes
- Page 454 and 455:
Pier Competition | Page 23
- Page 456:
Pier Competition | Page 25 Exhibit
- Page 460:
MICHAEL MALTZAN ARCHITECTURE, INC.


