December 2012 Number 1 - Utah Native Plant Society
December 2012 Number 1 - Utah Native Plant Society
December 2012 Number 1 - Utah Native Plant Society

Create successful ePaper yourself
Turn your PDF publications into a flip-book with our unique Google optimized e-Paper software.
<strong>Utah</strong> <strong>Native</strong> <strong>Plant</strong> <strong>Society</strong><br />
METHODS<br />
<strong>Plant</strong> Species<br />
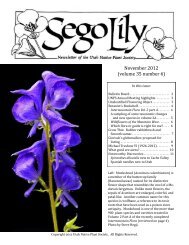
Penstemon harringtonii is a potentially long-lived<br />
perennial forb in the Scrophulariaceae. A distinctive<br />
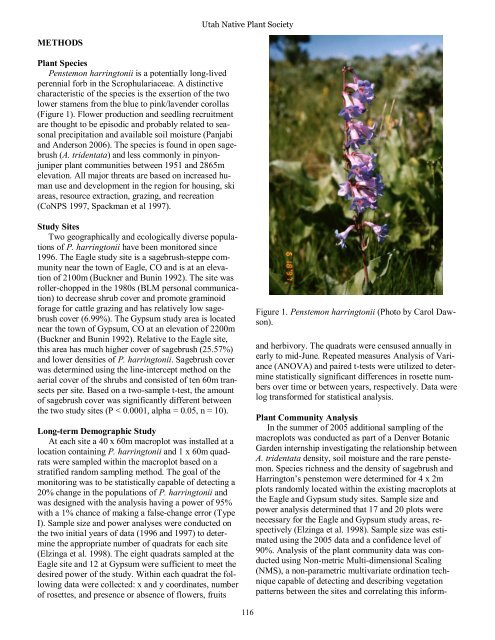
characteristic of the species is the exsertion of the two<br />
lower stamens from the blue to pink/lavender corollas<br />
(Figure 1). Flower production and seedling recruitment<br />
are thought to be episodic and probably related to seasonal<br />
precipitation and available soil moisture (Panjabi<br />
and Anderson 2006). The species is found in open sagebrush<br />
(A. tridentata) and less commonly in pinyonjuniper<br />
plant communities between 1951 and 2865m<br />
elevation. All major threats are based on increased human<br />
use and development in the region for housing, ski<br />
areas, resource extraction, grazing, and recreation<br />
(CoNPS 1997, Spackman et al 1997).<br />
Study Sites<br />
Two geographically and ecologically diverse populations<br />
of P. harringtonii have been monitored since<br />
1996. The Eagle study site is a sagebrush-steppe community<br />
near the town of Eagle, CO and is at an elevation<br />
of 2100m (Buckner and Bunin 1992). The site was<br />
roller-chopped in the 1980s (BLM personal communication)<br />
to decrease shrub cover and promote graminoid<br />
forage for cattle grazing and has relatively low sagebrush<br />
cover (6.99%). The Gypsum study area is located<br />
near the town of Gypsum, CO at an elevation of 2200m<br />
(Buckner and Bunin 1992). Relative to the Eagle site,<br />
this area has much higher cover of sagebrush (25.57%)<br />
and lower densities of P. harringtonii. Sagebrush cover<br />
was determined using the line-intercept method on the<br />
aerial cover of the shrubs and consisted of ten 60m transects<br />
per site. Based on a two-sample t-test, the amount<br />
of sagebrush cover was significantly different between<br />
the two study sites (P < 0.0001, alpha = 0.05, n = 10).<br />
Long-term Demographic Study<br />
At each site a 40 x 60m macroplot was installed at a<br />
location containing P. harringtonii and 1 x 60m quadrats<br />
were sampled within the macroplot based on a<br />
stratified random sampling method. The goal of the<br />
monitoring was to be statistically capable of detecting a<br />
20% change in the populations of P. harringtonii and<br />
was designed with the analysis having a power of 95%<br />
with a 1% chance of making a false-change error (Type<br />
I). Sample size and power analyses were conducted on<br />
the two initial years of data (1996 and 1997) to determine<br />
the appropriate number of quadrats for each site<br />
(Elzinga et al. 1998). The eight quadrats sampled at the<br />
Eagle site and 12 at Gypsum were sufficient to meet the<br />
desired power of the study. Within each quadrat the following<br />
data were collected: x and y coordinates, number<br />
of rosettes, and presence or absence of flowers, fruits<br />
Figure 1. Penstemon harringtonii (Photo by Carol Dawson).<br />
and herbivory. The quadrats were censused annually in<br />
early to mid-June. Repeated measures Analysis of Variance<br />
(ANOVA) and paired t-tests were utilized to determine<br />
statistically significant differences in rosette numbers<br />
over time or between years, respectively. Data were<br />
log transformed for statistical analysis.<br />
<strong>Plant</strong> Community Analysis<br />
In the summer of 2005 additional sampling of the<br />
macroplots was conducted as part of a Denver Botanic<br />
Garden internship investigating the relationship between<br />
A. tridentata density, soil moisture and the rare penstemon.<br />
Species richness and the density of sagebrush and<br />
Harrington’s penstemon were determined for 4 x 2m<br />
plots randomly located within the existing macroplots at<br />
the Eagle and Gypsum study sites. Sample size and<br />
power analysis determined that 17 and 20 plots were<br />
necessary for the Eagle and Gypsum study areas, respectively<br />
(Elzinga et al. 1998). Sample size was estimated<br />
using the 2005 data and a confidence level of<br />
90%. Analysis of the plant community data was conducted<br />
using Non-metric Multi-dimensional Scaling<br />
(NMS), a non-parametric multivariate ordination technique<br />
capable of detecting and describing vegetation<br />
patterns between the sites and correlating this inform-<br />
116