December 2012 Number 1 - Utah Native Plant Society
December 2012 Number 1 - Utah Native Plant Society
December 2012 Number 1 - Utah Native Plant Society

Create successful ePaper yourself
Turn your PDF publications into a flip-book with our unique Google optimized e-Paper software.
<strong>Utah</strong> <strong>Native</strong> <strong>Plant</strong> <strong>Society</strong><br />
mum score for P. gibbensii is 6 points, while the potential<br />
score is 8. The average of the two scores is 7, earning<br />
P. gibbensii a place on the UNPS Extremely High<br />
priority list.<br />
RESULTS<br />
The UNPS Rare <strong>Plant</strong> Committee met in January<br />
2009 to apply the Wyoming protocol to the entire flora<br />
of <strong>Utah</strong>. Based on the fourth edition of A <strong>Utah</strong> Flora<br />
(Welsh et al. 2008) and other recent literature (such as<br />
The Flora of North America and Intermountain Flora)<br />
we started with a pool of 4273 taxa* of vascular plants<br />
known to be native or introduced in <strong>Utah</strong>. We immediately<br />
removed 1017 cultivated and naturalized (nonnative)<br />
taxa, as we deemed these not to be of conservation<br />
importance in the state. Of the 3160 species native<br />
to <strong>Utah</strong>, we eliminated another 1421 common and widespread<br />
taxa (mostly ranked S4 or S5 by NatureServe) of<br />
*Taxa include full species and unique subspecies and varieties,<br />
treated here in the phylogenetic sense of Cracraft (1987)<br />
as the smallest evolutionary units that are diagnosably distinct.<br />
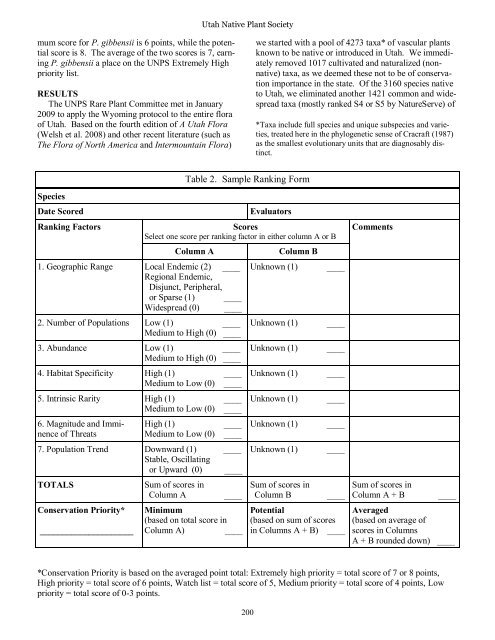
Table 2. Sample Ranking Form<br />
Species<br />
Date Scored<br />
Ranking Factors<br />
Evaluators<br />
Scores<br />
Select one score per ranking factor in either column A or B<br />
Column A<br />
1. Geographic Range Local Endemic (2) ____<br />
Regional Endemic,<br />
Disjunct, Peripheral,<br />
or Sparse (1) ____<br />
Widespread (0) ____<br />
2. <strong>Number</strong> of Populations Low (1) ____<br />
Medium to High (0) ____<br />
3. Abundance Low (1) ____<br />
Medium to High (0) ____<br />
4. Habitat Specificity High (1) ____<br />
Medium to Low (0) ____<br />
5. Intrinsic Rarity High (1) ____<br />
Medium to Low (0) ____<br />
6. Magnitude and Imminence<br />
of Threats<br />
High (1)<br />
Medium to Low (0)<br />
____<br />
____<br />
7. Population Trend Downward (1) ____<br />
Stable, Oscillating<br />
or Upward (0) ____<br />
TOTALS<br />
Conservation Priority*<br />
_____________________<br />
Sum of scores in<br />
Column A<br />
____<br />
Minimum<br />
(based on total score in<br />
Column A) ____<br />
Unknown (1)<br />
Unknown (1)<br />
Unknown (1)<br />
Unknown (1)<br />
Unknown (1)<br />
Unknown (1)<br />
Unknown (1)<br />
Column B<br />
Sum of scores in<br />
Column B<br />
____<br />
____<br />
____<br />
____<br />
____<br />
____<br />
____<br />
____<br />
Potential<br />
(based on sum of scores<br />
in Columns A + B) ____<br />
Comments<br />
Sum of scores in<br />
Column A + B<br />
____<br />
Averaged<br />
(based on average of<br />
scores in Columns<br />
A + B rounded down) ____<br />
*Conservation Priority is based on the averaged point total: Extremely high priority = total score of 7 or 8 points,<br />
High priority = total score of 6 points, Watch list = total score of 5, Medium priority = total score of 4 points, Low<br />
priority = total score of 0-3 points.<br />
200