December 2012 Number 1 - Utah Native Plant Society
December 2012 Number 1 - Utah Native Plant Society
December 2012 Number 1 - Utah Native Plant Society

Create successful ePaper yourself
Turn your PDF publications into a flip-book with our unique Google optimized e-Paper software.
<strong>Utah</strong> <strong>Native</strong> <strong>Plant</strong> <strong>Society</strong><br />
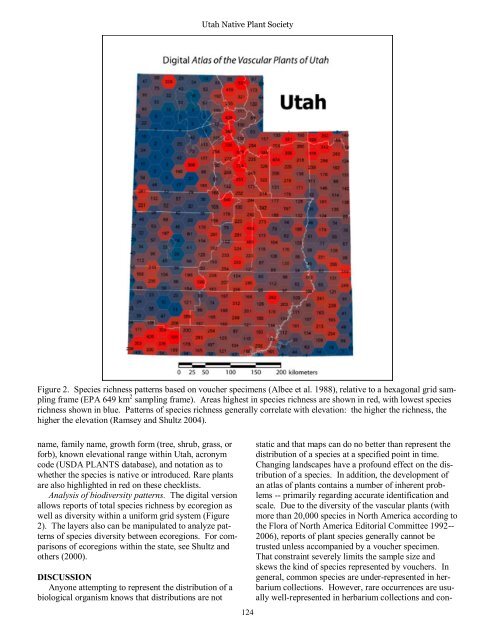
Figure 2. Species richness patterns based on voucher specimens (Albee et al. 1988), relative to a hexagonal grid sampling<br />
frame (EPA 649 km 2 sampling frame). Areas highest in species richness are shown in red, with lowest species<br />
richness shown in blue. Patterns of species richness generally correlate with elevation: the higher the richness, the<br />
higher the elevation (Ramsey and Shultz 2004).<br />
name, family name, growth form (tree, shrub, grass, or<br />
forb), known elevational range within <strong>Utah</strong>, acronym<br />
code (USDA PLANTS database), and notation as to<br />
whether the species is native or introduced. Rare plants<br />
are also highlighted in red on these checklists.<br />
Analysis of biodiversity patterns. The digital version<br />
allows reports of total species richness by ecoregion as<br />
well as diversity within a uniform grid system (Figure<br />
2). The layers also can be manipulated to analyze patterns<br />
of species diversity between ecoregions. For comparisons<br />
of ecoregions within the state, see Shultz and<br />
others (2000).<br />
DISCUSSION<br />
Anyone attempting to represent the distribution of a<br />
biological organism knows that distributions are not<br />
124<br />
static and that maps can do no better than represent the<br />
distribution of a species at a specified point in time.<br />
Changing landscapes have a profound effect on the distribution<br />
of a species. In addition, the development of<br />
an atlas of plants contains a number of inherent problems<br />
-- primarily regarding accurate identification and<br />
scale. Due to the diversity of the vascular plants (with<br />
more than 20,000 species in North America according to<br />
the Flora of North America Editorial Committee 1992--<br />
2006), reports of plant species generally cannot be<br />
trusted unless accompanied by a voucher specimen.<br />
That constraint severely limits the sample size and<br />
skews the kind of species represented by vouchers. In<br />
general, common species are under-represented in herbarium<br />
collections. However, rare occurrences are usually<br />
well-represented in herbarium collections and con-