December 2012 Number 1 - Utah Native Plant Society
December 2012 Number 1 - Utah Native Plant Society
December 2012 Number 1 - Utah Native Plant Society

Create successful ePaper yourself
Turn your PDF publications into a flip-book with our unique Google optimized e-Paper software.
<strong>Utah</strong> <strong>Native</strong> <strong>Plant</strong> <strong>Society</strong><br />
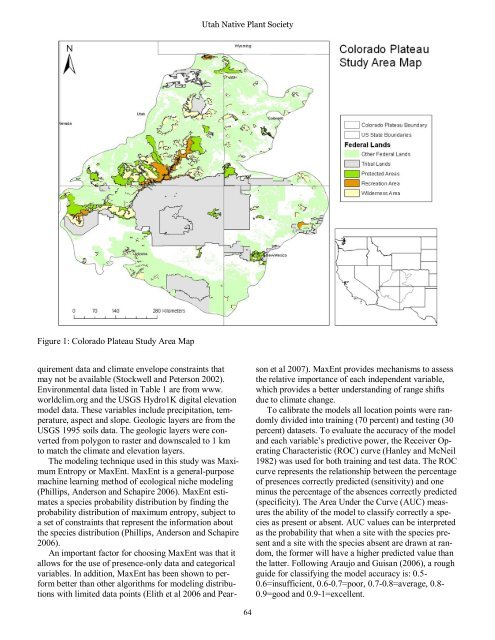
Figure 1: Colorado Plateau Study Area Map<br />
quirement data and climate envelope constraints that<br />
may not be available (Stockwell and Peterson 2002).<br />
Environmental data listed in Table 1 are from www.<br />
worldclim.org and the USGS Hydro1K digital elevation<br />
model data. These variables include precipitation, temperature,<br />
aspect and slope. Geologic layers are from the<br />
USGS 1995 soils data. The geologic layers were converted<br />
from polygon to raster and downscaled to 1 km<br />
to match the climate and elevation layers.<br />
The modeling technique used in this study was Maximum<br />
Entropy or MaxEnt. MaxEnt is a general-purpose<br />
machine learning method of ecological niche modeling<br />
(Phillips, Anderson and Schapire 2006). MaxEnt estimates<br />
a species probability distribution by finding the<br />
probability distribution of maximum entropy, subject to<br />
a set of constraints that represent the information about<br />
the species distribution (Phillips, Anderson and Schapire<br />
2006).<br />
An important factor for choosing MaxEnt was that it<br />
allows for the use of presence-only data and categorical<br />
variables. In addition, MaxEnt has been shown to perform<br />
better than other algorithms for modeling distributions<br />
with limited data points (Elith et al 2006 and Pear-<br />
son et al 2007). MaxEnt provides mechanisms to assess<br />
the relative importance of each independent variable,<br />
which provides a better understanding of range shifts<br />
due to climate change.<br />
To calibrate the models all location points were randomly<br />
divided into training (70 percent) and testing (30<br />
percent) datasets. To evaluate the accuracy of the model<br />
and each variable’s predictive power, the Receiver Operating<br />
Characteristic (ROC) curve (Hanley and McNeil<br />
1982) was used for both training and test data. The ROC<br />
curve represents the relationship between the percentage<br />
of presences correctly predicted (sensitivity) and one<br />
minus the percentage of the absences correctly predicted<br />
(specificity). The Area Under the Curve (AUC) measures<br />
the ability of the model to classify correctly a species<br />
as present or absent. AUC values can be interpreted<br />
as the probability that when a site with the species present<br />
and a site with the species absent are drawn at random,<br />
the former will have a higher predicted value than<br />
the latter. Following Araujo and Guisan (2006), a rough<br />
guide for classifying the model accuracy is: 0.5-<br />
0.6=insufficient, 0.6-0.7=poor, 0.7-0.8=average, 0.8-<br />
0.9=good and 0.9-1=excellent.<br />
64