December 2012 Number 1 - Utah Native Plant Society
December 2012 Number 1 - Utah Native Plant Society
December 2012 Number 1 - Utah Native Plant Society

Create successful ePaper yourself
Turn your PDF publications into a flip-book with our unique Google optimized e-Paper software.
Calochortiana <strong>December</strong> <strong>2012</strong> <strong>Number</strong> 1<br />
RESULTS<br />
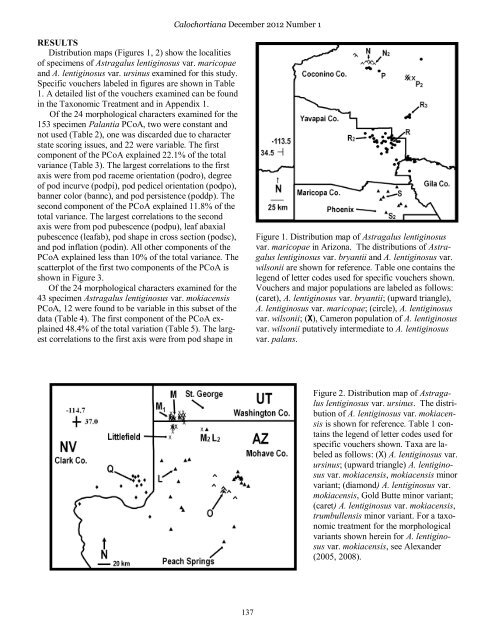
Distribution maps (Figures 1, 2) show the localities<br />
of specimens of Astragalus lentiginosus var. maricopae<br />
and A. lentiginosus var. ursinus examined for this study.<br />
Specific vouchers labeled in figures are shown in Table<br />
1. A detailed list of the vouchers examined can be found<br />
in the Taxonomic Treatment and in Appendix 1.<br />
Of the 24 morphological characters examined for the<br />
153 specimen Palantia PCoA, two were constant and<br />
not used (Table 2), one was discarded due to character<br />
state scoring issues, and 22 were variable. The first<br />
component of the PCoA explained 22.1% of the total<br />
variance (Table 3). The largest correlations to the first<br />
axis were from pod raceme orientation (podro), degree<br />
of pod incurve (podpi), pod pedicel orientation (podpo),<br />
banner color (bannc), and pod persistence (poddp). The<br />
second component of the PCoA explained 11.8% of the<br />
total variance. The largest correlations to the second<br />
axis were from pod pubescence (podpu), leaf abaxial<br />
pubescence (leafab), pod shape in cross section (podsc),<br />
and pod inflation (podin). All other components of the<br />
PCoA explained less than 10% of the total variance. The<br />
scatterplot of the first two components of the PCoA is<br />
shown in Figure 3.<br />
Of the 24 morphological characters examined for the<br />
43 specimen Astragalus lentiginosus var. mokiacensis<br />
PCoA, 12 were found to be variable in this subset of the<br />
data (Table 4). The first component of the PCoA explained<br />
48.4% of the total variation (Table 5). The largest<br />
correlations to the first axis were from pod shape in<br />
Figure 1. Distribution map of Astragalus lentiginosus<br />
var. maricopae in Arizona. The distributions of Astragalus<br />
lentiginosus var. bryantii and A. lentiginosus var.<br />
wilsonii are shown for reference. Table one contains the<br />
legend of letter codes used for specific vouchers shown.<br />
Vouchers and major populations are labeled as follows:<br />
(caret), A. lentiginosus var. bryantii; (upward triangle),<br />
A. lentiginosus var. maricopae; (circle), A. lentiginosus<br />
var. wilsonii; (X), Cameron population of A. lentiginosus<br />
var. wilsonii putatively intermediate to A. lentiginosus<br />
var. palans.<br />
Figure 2. Distribution map of Astragalus<br />
lentiginosus var. ursinus. The distribution<br />
of A. lentiginosus var. mokiacensis<br />
is shown for reference. Table 1 contains<br />
the legend of letter codes used for<br />
specific vouchers shown. Taxa are labeled<br />
as follows: (X) A. lentiginosus var.<br />
ursinus; (upward triangle) A. lentiginosus<br />
var. mokiacensis, mokiacensis minor<br />
variant; (diamond) A. lentiginosus var.<br />
mokiacensis, Gold Butte minor variant;<br />
(caret) A. lentiginosus var. mokiacensis,<br />
trumbullensis minor variant. For a taxonomic<br />
treatment for the morphological<br />
variants shown herein for A. lentiginosus<br />
var. mokiacensis, see Alexander<br />
(2005, 2008).<br />
137