December 2012 Number 1 - Utah Native Plant Society
December 2012 Number 1 - Utah Native Plant Society
December 2012 Number 1 - Utah Native Plant Society

Create successful ePaper yourself
Turn your PDF publications into a flip-book with our unique Google optimized e-Paper software.
Calochortiana <strong>December</strong> <strong>2012</strong> <strong>Number</strong> 1<br />
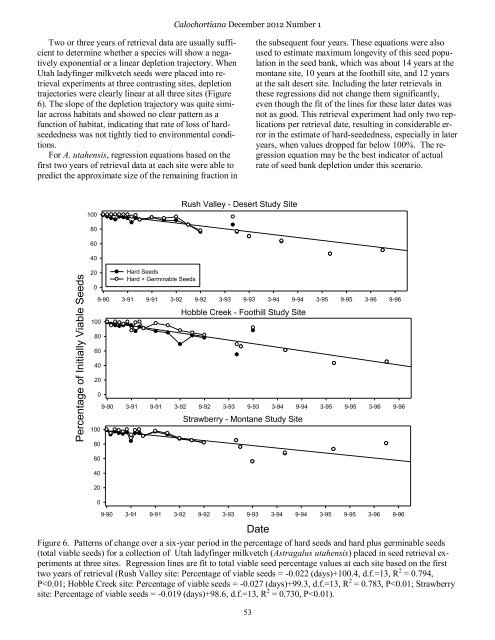
Two or three years of retrieval data are usually sufficient<br />
to determine whether a species will show a negatively<br />
exponential or a linear depletion trajectory. When<br />
<strong>Utah</strong> ladyfinger milkvetch seeds were placed into retrieval<br />
experiments at three contrasting sites, depletion<br />
trajectories were clearly linear at all three sites (Figure<br />
6). The slope of the depletion trajectory was quite similar<br />
across habitats and showed no clear pattern as a<br />
function of habitat, indicating that rate of loss of hardseededness<br />
was not tightly tied to environmental conditions.<br />
For A. utahensis, regression equations based on the<br />
first two years of retrieval data at each site were able to<br />
predict the approximate size of the remaining fraction in<br />
the subsequent four years. These equations were also<br />
used to estimate maximum longevity of this seed population<br />
in the seed bank, which was about 14 years at the<br />
montane site, 10 years at the foothill site, and 12 years<br />
at the salt desert site. Including the later retrievals in<br />
these regressions did not change them significantly,<br />
even though the fit of the lines for these later dates was<br />
not as good. This retrieval experiment had only two replications<br />
per retrieval date, resulting in considerable error<br />
in the estimate of hard-seededness, especially in later<br />
years, when values dropped far below 100%. The regression<br />
equation may be the best indicator of actual<br />
rate of seed bank depletion under this scenario.<br />
100<br />
Rush Valley - Desert Study Site<br />
80<br />
60<br />
40<br />
Percentage of Initially Viable Seeds<br />
20<br />
0<br />
100<br />
80<br />
60<br />
40<br />
20<br />
0<br />
100<br />
80<br />
Hard Seeds<br />
Hard + Germinable Seeds<br />
9-90 3-91 9-91 3-92 9-92 3-93 9-93 3-94 9-94 3-95 9-95 3-96 9-96<br />
Hobble Creek - Foothill Study Site<br />
9-90 3-91 9-91 3-92 9-92 3-93 9-93 3-94 9-94 3-95 9-95 3-96 9-96<br />
Strawberry - Montane Study Site<br />
60<br />
40<br />
20<br />
0<br />
9-90 3-91 9-91 3-92 9-92 3-93 9-93 3-94 9-94 3-95 9-95 3-96 9-96<br />
Date<br />
Figure 6. Patterns of change over a six-year period in the percentage of hard seeds and hard plus germinable seeds<br />
(total viable seeds) for a collection of <strong>Utah</strong> ladyfinger milkvetch (Astragalus utahensis) placed in seed retrieval experiments<br />
at three sites. Regression lines are fit to total viable seed percentage values at each site based on the first<br />
two years of retrieval (Rush Valley site: Percentage of viable seeds = -0.022 (days)+100.4, d.f.=13, R 2 = 0.794,<br />
P