December 2012 Number 1 - Utah Native Plant Society
December 2012 Number 1 - Utah Native Plant Society
December 2012 Number 1 - Utah Native Plant Society

Create successful ePaper yourself
Turn your PDF publications into a flip-book with our unique Google optimized e-Paper software.
<strong>Utah</strong> <strong>Native</strong> <strong>Plant</strong> <strong>Society</strong><br />
ing the distant relationship between it and the other<br />
Phacelia samples. This was a consequence of the large<br />
number of AFLP bands that were polymorphic between<br />
P. crenulata and the other three species (Table 1).<br />
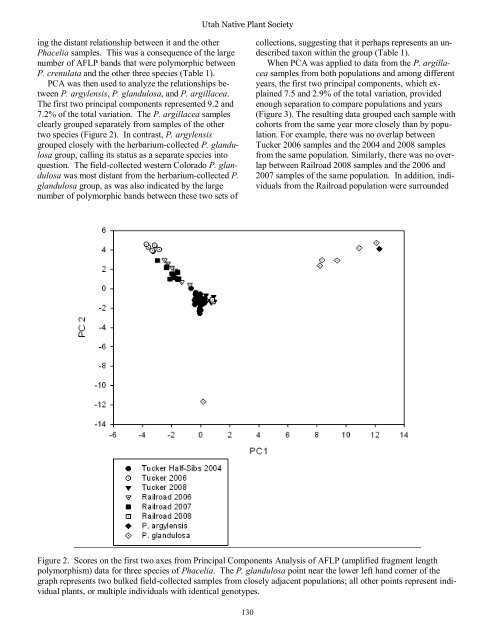
PCA was then used to analyze the relationships between<br />
P. argylensis, P. glandulosa, and P. argillacea.<br />
The first two principal components represented 9.2 and<br />
7.2% of the total variation. The P. argillacea samples<br />
clearly grouped separately from samples of the other<br />
two species (Figure 2). In contrast, P. argylensis<br />
grouped closely with the herbarium-collected P. glandulosa<br />
group, calling its status as a separate species into<br />
question. The field-collected western Colorado P. glandulosa<br />
was most distant from the herbarium-collected P.<br />
glandulosa group, as was also indicated by the large<br />
number of polymorphic bands between these two sets of<br />
collections, suggesting that it perhaps represents an undescribed<br />
taxon within the group (Table 1).<br />
When PCA was applied to data from the P. argillacea<br />
samples from both populations and among different<br />
years, the first two principal components, which explained<br />
7.5 and 2.9% of the total variation, provided<br />
enough separation to compare populations and years<br />
(Figure 3). The resulting data grouped each sample with<br />
cohorts from the same year more closely than by population.<br />
For example, there was no overlap between<br />
Tucker 2006 samples and the 2004 and 2008 samples<br />
from the same population. Similarly, there was no overlap<br />
between Railroad 2008 samples and the 2006 and<br />
2007 samples of the same population. In addition, individuals<br />
from the Railroad population were surrounded<br />
Figure 2. Scores on the first two axes from Principal Components Analysis of AFLP (amplified fragment length<br />
polymorphism) data for three species of Phacelia. The P. glandulosa point near the lower left hand corner of the<br />
graph represents two bulked field-collected samples from closely adjacent populations; all other points represent individual<br />
plants, or multiple individuals with identical genotypes.<br />
130