December 2012 Number 1 - Utah Native Plant Society
December 2012 Number 1 - Utah Native Plant Society
December 2012 Number 1 - Utah Native Plant Society

You also want an ePaper? Increase the reach of your titles
YUMPU automatically turns print PDFs into web optimized ePapers that Google loves.
<strong>Utah</strong> <strong>Native</strong> <strong>Plant</strong> <strong>Society</strong><br />
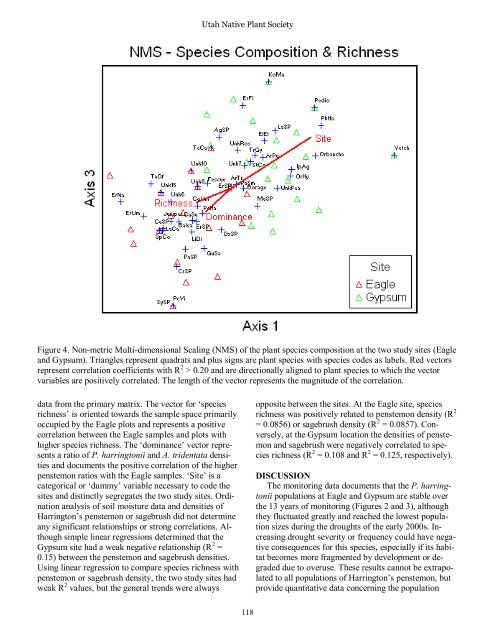
Figure 4. Non-metric Multi-dimensional Scaling (NMS) of the plant species composition at the two study sites (Eagle<br />
and Gypsum). Triangles represent quadrats and plus signs are plant species with species codes as labels. Red vectors<br />
represent correlation coefficients with R 2 > 0.20 and are directionally aligned to plant species to which the vector<br />
variables are positively correlated. The length of the vector represents the magnitude of the correlation.<br />
data from the primary matrix. The vector for ‘species<br />
richness’ is oriented towards the sample space primarily<br />
occupied by the Eagle plots and represents a positive<br />
correlation between the Eagle samples and plots with<br />
higher species richness. The ‘dominance’ vector represents<br />
a ratio of P. harringtonii and A. tridentata densities<br />
and documents the positive correlation of the higher<br />
penstemon ratios with the Eagle samples. ‘Site’ is a<br />
categorical or ‘dummy’ variable necessary to code the<br />
sites and distinctly segregates the two study sites. Ordination<br />
analysis of soil moisture data and densities of<br />
Harrington’s penstemon or sagebrush did not determine<br />
any significant relationships or strong correlations. Although<br />
simple linear regressions determined that the<br />
Gypsum site had a weak negative relationship (R 2 =<br />
0.15) between the penstemon and sagebrush densities.<br />
Using linear regression to compare species richness with<br />
penstemon or sagebrush density, the two study sites had<br />
weak R 2 values, but the general trends were always<br />
opposite between the sites. At the Eagle site, species<br />
richness was positively related to penstemon density (R 2<br />
= 0.0856) or sagebrush density (R 2 = 0.0857). Conversely,<br />
at the Gypsum location the densities of penstemon<br />
and sagebrush were negatively correlated to species<br />
richness (R 2 = 0.108 and R 2 = 0.125, respectively).<br />
DISCUSSION<br />
The monitoring data documents that the P. harringtonii<br />
populations at Eagle and Gypsum are stable over<br />
the 13 years of monitoring (Figures 2 and 3), although<br />
they fluctuated greatly and reached the lowest population<br />
sizes during the droughts of the early 2000s. Increasing<br />
drought severity or frequency could have negative<br />
consequences for this species, especially if its habitat<br />
becomes more fragmented by development or degraded<br />
due to overuse. These results cannot be extrapolated<br />
to all populations of Harrington’s penstemon, but<br />
provide quantitative data concerning the population<br />
118