Annual Report 2011 - Ford Motor Company
Annual Report 2011 - Ford Motor Company
Annual Report 2011 - Ford Motor Company

Create successful ePaper yourself
Turn your PDF publications into a flip-book with our unique Google optimized e-Paper software.
Notes to the Financial Statements<br />
NOTE 4. FAIR VALUE MEASUREMENTS (Continued)<br />
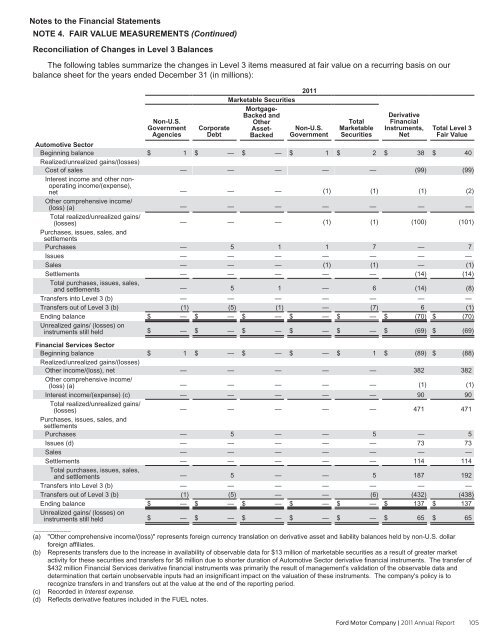
Reconciliation of Changes in Level 3 Balances<br />
The following tables summarize the changes in Level 3 items measured at fair value on a recurring basis on our<br />
balance sheet for the years ended December 31 (in millions):<br />
Automotive Sector<br />
Beginning balance<br />
Realized/unrealized gains/(losses)<br />
Cost of sales<br />
Interest income and other nonoperating<br />
income/(expense),<br />
net<br />
Other comprehensive income/<br />
(loss) (a)<br />
Total realized/unrealized gains/<br />
(losses)<br />
Purchases, issues, sales, and<br />
settlements<br />
Purchases<br />
Issues<br />
Sales<br />
Settlements<br />
Total purchases, issues, sales,<br />
and settlements<br />
Transfers into Level 3 (b)<br />
Transfers out of Level 3 (b)<br />
Ending balance<br />
Unrealized gains/ (losses) on<br />
instruments still held<br />
Financial Services Sector<br />
Beginning balance<br />
Realized/unrealized gains/(losses)<br />
Other income/(loss), net<br />
Other comprehensive income/<br />
(loss) (a)<br />
Interest income/(expense) (c)<br />
Total realized/unrealized gains/<br />
(losses)<br />
Purchases, issues, sales, and<br />
settlements<br />
Purchases<br />
Issues (d)<br />
Sales<br />
Settlements<br />
Total purchases, issues, sales,<br />
and settlements<br />
Transfers into Level 3 (b)<br />
Transfers out of Level 3 (b)<br />
Ending balance<br />
Unrealized gains/ (losses) on<br />
instruments still held<br />
Non-U.S.<br />
Government<br />
Agencies<br />
$ 1<br />
—<br />
—<br />
—<br />
—<br />
—<br />
—<br />
—<br />
—<br />
$ —<br />
$ 1<br />
—<br />
—<br />
—<br />
—<br />
—<br />
—<br />
—<br />
—<br />
$ —<br />
Corporate<br />
Debt<br />
$ —<br />
Marketable Securities<br />
—<br />
—<br />
—<br />
—<br />
5<br />
—<br />
—<br />
—<br />
$ —<br />
$ —<br />
—<br />
—<br />
—<br />
—<br />
5<br />
—<br />
—<br />
—<br />
$ —<br />
Mortgage-<br />
Backed and<br />
Other<br />
Asset-<br />
Backed<br />
$ —<br />
—<br />
—<br />
—<br />
—<br />
1<br />
—<br />
—<br />
—<br />
$ —<br />
$ —<br />
—<br />
—<br />
—<br />
—<br />
—<br />
—<br />
—<br />
—<br />
$ —<br />
<strong>2011</strong><br />
Non-U.S.<br />
Government<br />
$ 1<br />
—<br />
(1)<br />
—<br />
(1)<br />
1<br />
—<br />
(1)<br />
—<br />
$ —<br />
$ —<br />
—<br />
—<br />
—<br />
—<br />
—<br />
—<br />
—<br />
—<br />
$ —<br />
Total<br />
Marketable<br />
Securities<br />
$ 2<br />
—<br />
(1)<br />
—<br />
(1)<br />
7<br />
—<br />
(1)<br />
—<br />
$ —<br />
$ 1<br />
—<br />
—<br />
—<br />
—<br />
5<br />
—<br />
—<br />
—<br />
$ —<br />
Derivative<br />
Financial<br />
Instruments,<br />
Net<br />
$ 38<br />
(99)<br />
(1)<br />
<strong>Ford</strong> <strong>Motor</strong> <strong>Company</strong> | <strong>2011</strong> <strong>Annual</strong> <strong>Report</strong> 105<br />
—<br />
(100)<br />
—<br />
—<br />
—<br />
(14)<br />
$ (69)<br />
$ (89)<br />
382<br />
(1)<br />
90<br />
471<br />
—<br />
73<br />
—<br />
114<br />
$ 65<br />
Total Level 3<br />
Fair Value<br />
$ 40<br />
—<br />
5<br />
1<br />
—<br />
6<br />
(14)<br />
(8)<br />
—<br />
—<br />
—<br />
—<br />
—<br />
—<br />
—<br />
(1)<br />
(5)<br />
(1)<br />
—<br />
(7)<br />
6<br />
(1)<br />
$ — $ — $ — $ — $ — $ (70) $ (70)<br />
(99)<br />
(2)<br />
—<br />
(101)<br />
7<br />
—<br />
(1)<br />
(14)<br />
$ (69)<br />
$ (88)<br />
—<br />
5<br />
—<br />
—<br />
5<br />
187<br />
192<br />
—<br />
—<br />
—<br />
—<br />
—<br />
—<br />
—<br />
(1)<br />
(5)<br />
—<br />
—<br />
(6)<br />
(432) (438)<br />
$ — $ — $ — $ — $ — $ 137 $ 137<br />
382<br />
(1)<br />
90<br />
471<br />
5<br />
73<br />
—<br />
114<br />
$ 65<br />
__________<br />
(a) "Other comprehensive income/(loss)" represents foreign currency translation on derivative asset and liability balances held by non-U.S. dollar<br />
foreign affiliates.<br />
(b) Represents transfers due to the increase in availability of observable data for $13 million of marketable securities as a result of greater market<br />
activity for these securities and transfers for $6 million due to shorter duration of Automotive Sector derivative financial instruments. The transfer of<br />
$432 million Financial Services derivative financial instruments was primarily the result of management's validation of the observable data and<br />
determination that certain unobservable inputs had an insignificant impact on the valuation of these instruments. The company's policy is to<br />
recognize transfers in and transfers out at the value at the end of the reporting period.<br />
(c) Recorded in Interest expense.<br />
(d) Reflects derivative features included in the FUEL notes.