Annual Report 2011 - Ford Motor Company
Annual Report 2011 - Ford Motor Company
Annual Report 2011 - Ford Motor Company

Create successful ePaper yourself
Turn your PDF publications into a flip-book with our unique Google optimized e-Paper software.
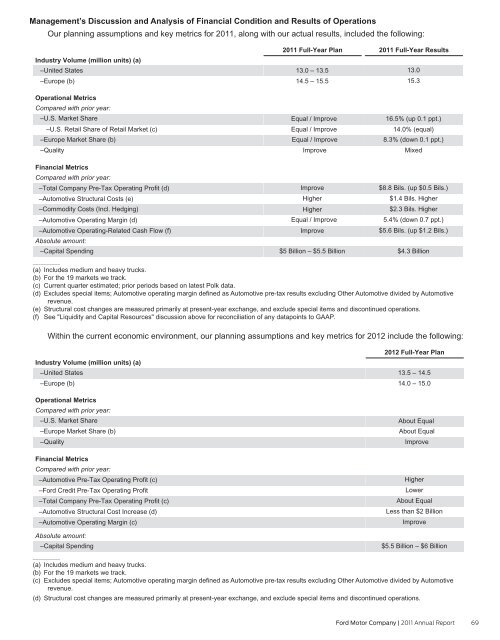
Management’s Discussion and Analysis of Financial Condition and Results of Operations<br />
Our planning assumptions and key metrics for <strong>2011</strong>, along with our actual results, included the following:<br />
Industry Volume (million units) (a)<br />
–United States<br />
–Europe (b)<br />
Operational Metrics<br />
Compared with prior year:<br />
–U.S. Market Share<br />
–U.S. Retail Share of Retail Market (c)<br />
–Europe Market Share (b)<br />
–Quality<br />
Financial Metrics<br />
Compared with prior year:<br />
–Total <strong>Company</strong> Pre-Tax Operating Profit (d)<br />
–Automotive Structural Costs (e)<br />
–Commodity Costs (Incl. Hedging)<br />
–Automotive Operating Margin (d)<br />
–Automotive Operating-Related Cash Flow (f)<br />
Absolute amount:<br />
–Capital Spending<br />
<strong>2011</strong> Full-Year Plan<br />
13.0 – 13.5<br />
14.5 – 15.5<br />
Equal / Improve<br />
Equal / Improve<br />
Equal / Improve<br />
Improve<br />
Improve<br />
Higher<br />
Higher<br />
Equal / Improve<br />
Improve<br />
$5 Billion – $5.5 Billion<br />
<strong>2011</strong> Full-Year Results<br />
13.0<br />
15.3<br />
16.5% (up 0.1 ppt.)<br />
14.0% (equal)<br />
8.3% (down 0.1 ppt.)<br />
Mixed<br />
$8.8 Bils. (up $0.5 Bils.)<br />
$1.4 Bils. Higher<br />
$2.3 Bils. Higher<br />
5.4% (down 0.7 ppt.)<br />
$5.6 Bils. (up $1.2 Bils.)<br />
$4.3 Billion<br />
__________<br />
(a) Includes medium and heavy trucks.<br />
(b) For the 19 markets we track.<br />
(c) Current quarter estimated; prior periods based on latest Polk data.<br />
(d) Excludes special items; Automotive operating margin defined as Automotive pre-tax results excluding Other Automotive divided by Automotive<br />
revenue.<br />
(e) Structural cost changes are measured primarily at present-year exchange, and exclude special items and discontinued operations.<br />
(f) See "Liquidity and Capital Resources" discussion above for reconciliation of any datapoints to GAAP.<br />
Within the current economic environment, our planning assumptions and key metrics for 2012 include the following:<br />
Industry Volume (million units) (a)<br />
–United States<br />
–Europe (b)<br />
Operational Metrics<br />
Compared with prior year:<br />
–U.S. Market Share<br />
–Europe Market Share (b)<br />
–Quality<br />
Financial Metrics<br />
Compared with prior year:<br />
–Automotive Pre-Tax Operating Profit (c)<br />
–<strong>Ford</strong> Credit Pre-Tax Operating Profit<br />
–Total <strong>Company</strong> Pre-Tax Operating Profit (c)<br />
–Automotive Structural Cost Increase (d)<br />
–Automotive Operating Margin (c)<br />
Absolute amount:<br />
–Capital Spending<br />
2012 Full-Year Plan<br />
13.5 – 14.5<br />
14.0 – 15.0<br />
About Equal<br />
About Equal<br />
Improve<br />
Higher<br />
Lower<br />
About Equal<br />
Less than $2 Billion<br />
Improve<br />
$5.5 Billion – $6 Billion<br />
__________<br />
(a) Includes medium and heavy trucks.<br />
(b) For the 19 markets we track.<br />
(c) Excludes special items; Automotive operating margin defined as Automotive pre-tax results excluding Other Automotive divided by Automotive<br />
revenue.<br />
(d) Structural cost changes are measured primarily at present-year exchange, and exclude special items and discontinued operations.<br />
<strong>Ford</strong> <strong>Motor</strong> <strong>Company</strong> | <strong>2011</strong> <strong>Annual</strong> <strong>Report</strong> 69