Annual Report 2011 - Ford Motor Company
Annual Report 2011 - Ford Motor Company
Annual Report 2011 - Ford Motor Company

Create successful ePaper yourself
Turn your PDF publications into a flip-book with our unique Google optimized e-Paper software.
Management’s Discussion and Analysis of Financial Condition and Results of Operations<br />
The average maturity of these investments ranges from 90 days to up to one year and is adjusted based on market<br />
conditions and liquidity needs. We monitor our cash levels and average maturity on a daily basis.<br />
In managing our business, we classify changes in Automotive gross cash into operating-related and other items<br />
(which includes the impact of certain special items, contributions to funded pension plans, certain tax-related transactions,<br />
acquisitions and divestitures, capital transactions with the Financial Services sector, dividends paid to shareholders, and<br />
other - primarily financing-related). Our key liquidity metrics are operating-related cash flow (which best represents the<br />
ability of our Automotive operations to generate cash), Automotive gross cash, and Automotive liquidity. These items at<br />
December 31 were as follows (in billions):<br />
Gross cash<br />
Available credit lines:<br />
Secured credit facility, unutilized portion<br />
Local lines available to foreign affiliates, unutilized portion<br />
Automotive liquidity<br />
<strong>2011</strong><br />
$ 22.9<br />
8.8<br />
0.7<br />
$ 32.4<br />
2010<br />
$ 20.5<br />
6.9<br />
0.5<br />
$ 27.9<br />
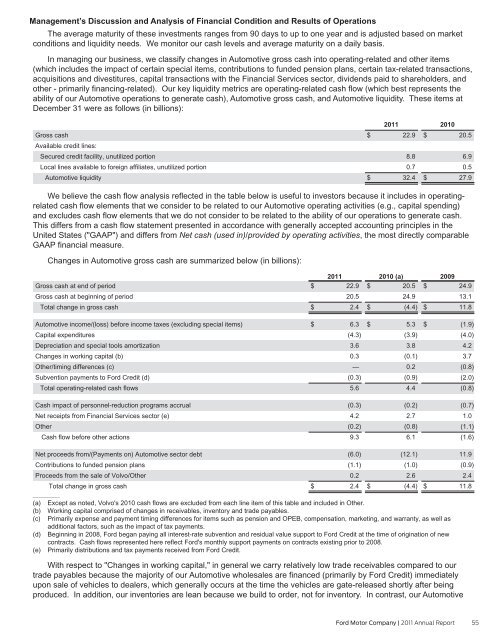
We believe the cash flow analysis reflected in the table below is useful to investors because it includes in operatingrelated<br />
cash flow elements that we consider to be related to our Automotive operating activities (e.g., capital spending)<br />
and excludes cash flow elements that we do not consider to be related to the ability of our operations to generate cash.<br />
This differs from a cash flow statement presented in accordance with generally accepted accounting principles in the<br />
United States ("GAAP") and differs from Net cash (used in)/provided by operating activities, the most directly comparable<br />
GAAP financial measure.<br />
Changes in Automotive gross cash are summarized below (in billions):<br />
Gross cash at end of period<br />
Gross cash at beginning of period<br />
Total change in gross cash<br />
Automotive income/(loss) before income taxes (excluding special items)<br />
Capital expenditures<br />
Depreciation and special tools amortization<br />
Changes in working capital (b)<br />
Other/timing differences (c)<br />
Subvention payments to <strong>Ford</strong> Credit (d)<br />
Total operating-related cash flows<br />
Cash impact of personnel-reduction programs accrual<br />
Net receipts from Financial Services sector (e)<br />
Other<br />
Cash flow before other actions<br />
Net proceeds from/(Payments on) Automotive sector debt<br />
Contributions to funded pension plans<br />
Proceeds from the sale of Volvo/Other<br />
Total change in gross cash<br />
<strong>2011</strong><br />
$ 22.9<br />
20.5<br />
$ 2.4<br />
$ 6.3<br />
(4.3)<br />
3.6<br />
0.3<br />
—<br />
(0.3)<br />
5.6<br />
(0.3)<br />
4.2<br />
(0.2)<br />
9.3<br />
(6.0)<br />
(1.1)<br />
0.2<br />
$ 2.4<br />
2010 (a)<br />
$ 20.5<br />
24.9<br />
$ (4.4)<br />
$ 5.3<br />
(3.9)<br />
3.8<br />
(0.1)<br />
0.2<br />
(0.9)<br />
4.4<br />
(0.2)<br />
2.7<br />
(0.8)<br />
6.1<br />
(12.1)<br />
(1.0)<br />
2.6<br />
$ (4.4)<br />
2009<br />
$ 24.9<br />
13.1<br />
$ 11.8<br />
$ (1.9)<br />
(4.0)<br />
4.2<br />
3.7<br />
(0.8)<br />
(2.0)<br />
(0.8)<br />
(0.7)<br />
1.0<br />
(1.1)<br />
(1.6)<br />
11.9<br />
(0.9)<br />
2.4<br />
$ 11.8<br />
__________<br />
(a) Except as noted, Volvo's 2010 cash flows are excluded from each line item of this table and included in Other.<br />
(b) Working capital comprised of changes in receivables, inventory and trade payables.<br />
(c) Primarily expense and payment timing differences for items such as pension and OPEB, compensation, marketing, and warranty, as well as<br />
additional factors, such as the impact of tax payments.<br />
(d) Beginning in 2008, <strong>Ford</strong> began paying all interest-rate subvention and residual value support to <strong>Ford</strong> Credit at the time of origination of new<br />
contracts. Cash flows represented here reflect <strong>Ford</strong>'s monthly support payments on contracts existing prior to 2008.<br />
(e) Primarily distributions and tax payments received from <strong>Ford</strong> Credit.<br />
With respect to "Changes in working capital," in general we carry relatively low trade receivables compared to our<br />
trade payables because the majority of our Automotive wholesales are financed (primarily by <strong>Ford</strong> Credit) immediately<br />
upon sale of vehicles to dealers, which generally occurs at the time the vehicles are gate-released shortly after being<br />
produced. In addition, our inventories are lean because we build to order, not for inventory. In contrast, our Automotive<br />
<strong>Ford</strong> <strong>Motor</strong> <strong>Company</strong> | <strong>2011</strong> <strong>Annual</strong> <strong>Report</strong> 55