Annual Report 2011 - Ford Motor Company
Annual Report 2011 - Ford Motor Company
Annual Report 2011 - Ford Motor Company

Create successful ePaper yourself
Turn your PDF publications into a flip-book with our unique Google optimized e-Paper software.
Notes to the Financial Statements<br />
NOTE 7. FINANCE RECEIVABLES (Continued)<br />
Included in the recorded investment in finance receivables at December 31, <strong>2011</strong> and 2010 were North America<br />
consumer receivables of $29.4 billion and $28.7 billion and non-consumer receivables of $14.2 billion and $12.8 billion,<br />
respectively, and International consumer receivables of $7.1 billion and $7.6 billion and non-consumer receivables of<br />
$5.6 billion and $5.9 billion, respectively, that secure certain debt obligations. The receivables are available only for<br />
payment of the related debt and obligations; they are not available to pay the other obligations of our Financial Services<br />
sector or the claims of its other creditors (see Notes 13 and 18).<br />
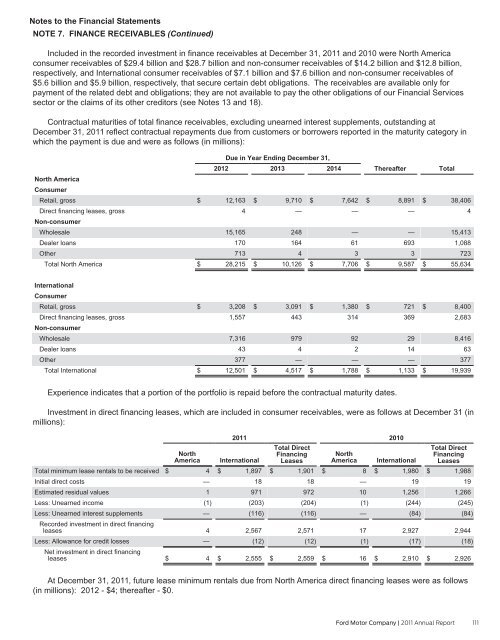
Contractual maturities of total finance receivables, excluding unearned interest supplements, outstanding at<br />
December 31, <strong>2011</strong> reflect contractual repayments due from customers or borrowers reported in the maturity category in<br />
which the payment is due and were as follows (in millions):<br />
North America<br />
Consumer<br />
Retail, gross<br />
Direct financing leases, gross<br />
Non-consumer<br />
Wholesale<br />
Dealer loans<br />
Other<br />
Total North America<br />
International<br />
Consumer<br />
Retail, gross<br />
Direct financing leases, gross<br />
Non-consumer<br />
Wholesale<br />
Dealer loans<br />
Other<br />
Total International<br />
Due in Year Ending December 31,<br />
2012<br />
2013<br />
2014<br />
$ 12,163<br />
4<br />
15,165<br />
170<br />
713<br />
$ 28,215<br />
$ 3,208<br />
1,557<br />
7,316<br />
43<br />
377<br />
$ 12,501<br />
$ 9,710<br />
—<br />
248<br />
164<br />
4<br />
$ 10,126<br />
$ 3,091<br />
443<br />
979<br />
4<br />
—<br />
$ 4,517<br />
$ 7,642<br />
—<br />
—<br />
61<br />
3<br />
$ 7,706<br />
$ 1,380<br />
314<br />
92<br />
2<br />
—<br />
$ 1,788<br />
Thereafter<br />
$ 8,891<br />
—<br />
—<br />
693<br />
3<br />
$ 9,587<br />
$ 721<br />
369<br />
29<br />
14<br />
—<br />
$ 1,133<br />
Experience indicates that a portion of the portfolio is repaid before the contractual maturity dates.<br />
Total<br />
$ 38,406<br />
4<br />
15,413<br />
1,088<br />
723<br />
$ 55,634<br />
$ 8,400<br />
2,683<br />
8,416<br />
63<br />
377<br />
$ 19,939<br />
Investment in direct financing leases, which are included in consumer receivables, were as follows at December 31 (in<br />
millions):<br />
Total minimum lease rentals to be received<br />
Initial direct costs<br />
Estimated residual values<br />
Less: Unearned income<br />
Less: Unearned interest supplements<br />
Recorded investment in direct financing<br />
leases<br />
Less: Allowance for credit losses<br />
Net investment in direct financing<br />
leases<br />
North<br />
America<br />
$ 4<br />
—<br />
1<br />
(1)<br />
—<br />
4<br />
—<br />
$ 4<br />
<strong>2011</strong><br />
International<br />
$ 1,897<br />
18<br />
971<br />
(203)<br />
(116)<br />
2,567<br />
(12)<br />
$ 2,555<br />
Total Direct<br />
Financing<br />
Leases<br />
$ 1,901<br />
18<br />
972<br />
(204)<br />
(116)<br />
2,571<br />
(12)<br />
$ 2,559<br />
North<br />
America<br />
$ 8<br />
—<br />
10<br />
(1)<br />
—<br />
17<br />
(1)<br />
$ 16<br />
2010<br />
International<br />
$ 1,980<br />
19<br />
1,256<br />
(244)<br />
(84)<br />
2,927<br />
(17)<br />
$ 2,910<br />
Total Direct<br />
Financing<br />
Leases<br />
$ 1,988<br />
19<br />
1,266<br />
(245)<br />
(84)<br />
2,944<br />
(18)<br />
$ 2,926<br />
At December 31, <strong>2011</strong>, future lease minimum rentals due from North America direct financing leases were as follows<br />
(in millions): 2012 - $4; thereafter - $0.<br />
<strong>Ford</strong> <strong>Motor</strong> <strong>Company</strong> | <strong>2011</strong> <strong>Annual</strong> <strong>Report</strong> 111