- Page 1 and 2:
PROFITABLE GROWTH FOR ALL Ford Moto
- Page 3 and 4:
ON THE COVER The all-new Ford Fusio
- Page 5 and 6:
A MESSAGE FROM THE PRESIDENT AND CE
- Page 7 and 8:
Environmental and social goals are
- Page 9 and 10:
1 1) Joe Hinrichs, Group Vice Presi
- Page 11 and 12:
To meet regional needs in Asia Paci
- Page 13 and 14:
UTILITIES The latest One Ford globa
- Page 15 and 16:
LINCOLN CUTTING-EDGE PRODUCTS, PERS
- Page 17 and 18:
GREEN 2 Ford continues to work to f
- Page 19 and 20:
SMART As technology becomes ever mo
- Page 21 and 22:
1) Ford team at the ringing of the
- Page 23 and 24:
THE POWER OF CHOICE With record sal
- Page 25 and 26:
PEOPLE HELPING PEOPLE Ford voluntee
- Page 27 and 28:
FINANCIAL CONTENT * 26 Management
- Page 29 and 30:
Management’s Discussion and Analy
- Page 31 and 32:
Management’s Discussion and Analy
- Page 33 and 34:
Management’s Discussion and Analy
- Page 35 and 36:
Management’s Discussion and Analy
- Page 37 and 38:
Management’s Discussion and Analy
- Page 39 and 40:
Management’s Discussion and Analy
- Page 41 and 42:
Management’s Discussion and Analy
- Page 43 and 44:
Management’s Discussion and Analy
- Page 45 and 46:
Management’s Discussion and Analy
- Page 47 and 48:
Management’s Discussion and Analy
- Page 49 and 50:
Management’s Discussion and Analy
- Page 51 and 52:
Management’s Discussion and Analy
- Page 53 and 54:
Management’s Discussion and Analy
- Page 55 and 56:
Management’s Discussion and Analy
- Page 57 and 58:
Management’s Discussion and Analy
- Page 59 and 60:
Management’s Discussion and Analy
- Page 61 and 62:
Management’s Discussion and Analy
- Page 63 and 64:
Management’s Discussion and Analy
- Page 65 and 66:
Management’s Discussion and Analy
- Page 67 and 68:
Management’s Discussion and Analy
- Page 69 and 70:
Management’s Discussion and Analy
- Page 71 and 72:
Management’s Discussion and Analy
- Page 73 and 74:
Management’s Discussion and Analy
- Page 75 and 76:
Management’s Discussion and Analy
- Page 77 and 78:
Management’s Discussion and Analy
- Page 79 and 80:
Management’s Discussion and Analy
- Page 81 and 82:
Quantitative and Qualitative Disclo
- Page 83 and 84:
Quantitative and Qualitative Disclo
- Page 85 and 86:
Report of Independent Registered Pu
- Page 87 and 88:
Sector Statement of Operations FORD
- Page 89 and 90:
Sector Balance Sheet FORD MOTOR COM
- Page 91 and 92:
Condensed Sector Statement of Cash
- Page 93 and 94:
Notes to the Financial Statements F
- Page 95 and 96:
Notes to the Financial Statements N
- Page 97 and 98:
Notes to the Financial Statements N
- Page 99 and 100:
Notes to the Financial Statements N
- Page 101 and 102:
Notes to the Financial Statements N
- Page 103 and 104:
Notes to the Financial Statements N
- Page 105 and 106:
Notes to the Financial Statements N
- Page 107 and 108:
Notes to the Financial Statements N
- Page 109 and 110:
Notes to the Financial Statements N
- Page 111 and 112:
Notes to the Financial Statements N
- Page 113 and 114:
Notes to the Financial Statements N
- Page 115 and 116:
Notes to the Financial Statements N
- Page 117 and 118:
Notes to the Financial Statements N
- Page 119 and 120:
Notes to the Financial Statements N
- Page 121 and 122:
Notes to the Financial Statements N
- Page 123 and 124:
Notes to the Financial Statements N
- Page 125 and 126:
Notes to the Financial Statements N
- Page 127 and 128:
Notes to the Financial Statements N
- Page 129 and 130:
Notes to the Financial Statements N
- Page 131 and 132:
Notes to the Financial Statements N
- Page 133 and 134: Notes to the Financial Statements N
- Page 135 and 136: Notes to the Financial Statements N
- Page 137 and 138: Notes to the Financial Statements N
- Page 139 and 140: Notes to the Financial Statements N
- Page 141 and 142: Notes to the Financial Statements N
- Page 143 and 144: Notes to the Financial Statements N
- Page 145 and 146: Notes to the Financial Statements N
- Page 147 and 148: Notes to the Financial Statements N
- Page 149 and 150: Notes to the Financial Statements N
- Page 151 and 152: Notes to the Financial Statements N
- Page 153 and 154: Notes to the Financial Statements N
- Page 155 and 156: Notes to the Financial Statements N
- Page 157 and 158: Notes to the Financial Statements N
- Page 159 and 160: Notes to the Financial Statements N
- Page 161 and 162: Notes to the Financial Statements N
- Page 163 and 164: Notes to the Financial Statements N
- Page 165 and 166: Notes to the Financial Statements N
- Page 167 and 168: Notes to the Financial Statements N
- Page 169 and 170: Notes to the Financial Statements N
- Page 171 and 172: Notes to the Financial Statements N
- Page 173 and 174: Notes to the Financial Statements N
- Page 175 and 176: Notes to the Financial Statements N
- Page 177 and 178: Notes to the Financial Statements N
- Page 179 and 180: Notes to the Financial Statements N
- Page 181 and 182: Notes to the Financial Statements N
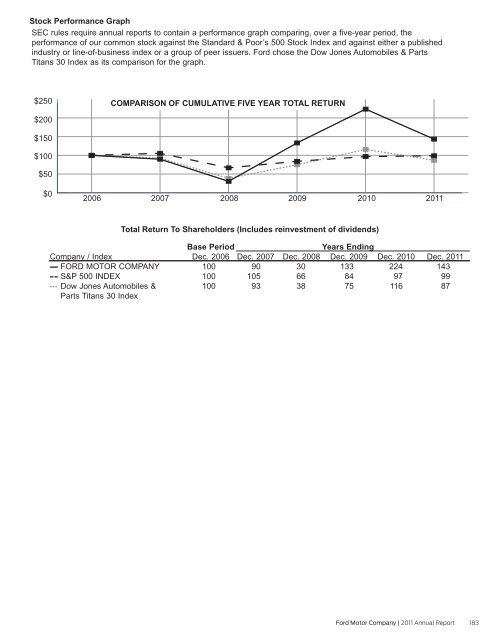
- Page 183: Employment Data The approximate num
- Page 187 and 188: GLOBAL OVERVIEW Automotive Brand Cu